The display program graphical performs plotting of data that has been stored in the Instrument Description File System (IDFS) format. The IDFS format is a data storage format that is designed to be general enough to handle the majority of scientific data sets. These data sets include raw telemetry, processed data, simulation data and theoretical data. IDFS data sources are defined as either scalar instruments or vector instruments. A scalar instrument returns singular data quantities that are dependent only upon time and position. A vector instrument returns one-dimensional data quantities that have a functional dependence on a single variable, which in IDFS terminology is called the scanning variable.
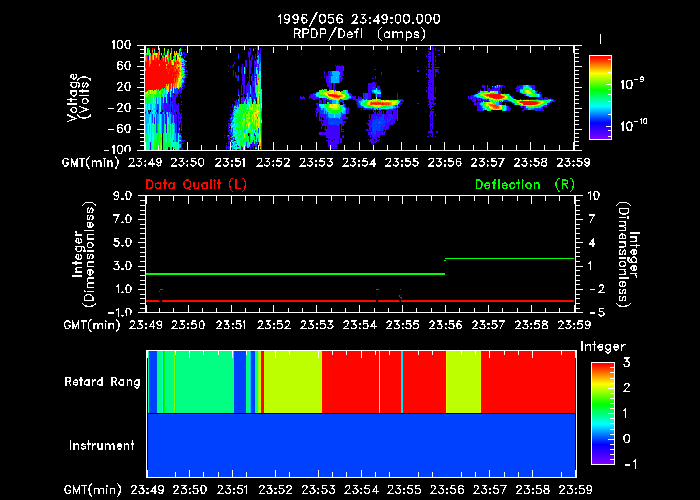
The graphical program utilizes three types of displays: (1) spectrograms, (2) spectro strips and (3) scalar plots. A spectrogram displays data in three dimensions: time (x-axis), scan variable (y-axis) and intensity (z-axis). The z-axis or intensity variable can be any of the available units defined for the selected IDFS data item. The IDFS format performs a real-time conversion of telemetry data into physical units as the data is accessed. This allows for the refinement of calibration factors and processing algorithms without having to reprocess the original data set.
Both the spectro strip and scalar plots display data in two dimensions, with one of those dimensions being time (x-axis). The other dimension can be any of the available units defined for the selected IDFS data item. The second dimension is displayed along the y-axis for a scalar plot; along the z-axis as intensity for spectro strip plots.
The graphical program is designed to work in one of two environments: real-time and playback. Real-time refers to the display of data as the data is being acquired and captured in the data files to be archived. For real-time displays, plotting does not terminate until an LOS (loss of signal) indicator is identified by the IDFS data access routines or an error condition is reached. When the end of the current panel (box) is reached, the display of the data starts back at the beginning of the panel and a white vertical line is drawn to help the user distinguish between old data and new data being displayed. Playback refers to the display of data that has been fully acquired and is archived in the database for public access. For the playback displays, data will continue to be plotted until the user-requested end time has been reached, data can no longer be retrieved from the database, the end of the panel has been reached or an error condition is reached. Unlike the real-time scenario, multiple panels are not available in the playback mode; only one panel of data is displayed per plotting session.
For spectrogram plots, the plotted data spectrum is generated by averaging or expanding sweeps of data. For spectro strip and scalar plots, the plotted data point is generated by averaging or expanding data values. Whether the data is averaged or expanded depends upon the amount of time that is represented by a single pixel along the x-axis. This accumulation rate can be calculated in one of three ways: (1) the user selects the IDFS source that will dictate the time per pixel value, (2) the user specifies the accumulation rate directly or (3) the accumulation rate is computed based upon the user-selected time range and the size of the box in which the data is to be displayed. The last option is only applicable for the playback scenario.
The graphical program can be invoked in one of two modes:
(1) interactive mode or (2) batch mode. In interactive mode, the program
utilizes a GUI-based definition session to define the data items to be
presented. The definition phase of the graphical program
has many options so that the user can tailor the displays to meet their
individual needs. Once the definition session has been completed, the selected
data items can then be displayed. To invoke the program in interactive
mode, type graphical at the command line. When the user is
accessing the graphical program from within
the SDDAS viewer, the program is always invoked in interactive mode.
In batch mode, the interactive GUI-based definition session is bypassed and
the data requested is immediately displayed based upon information
contained in the named layout file. To invoke the program in batch mode, type
graphical -FName filename at the command line. The argument
filename is the name of the layout file that is to be
utilized during the current display session. Note that the name of the
layout file does not include the .GPH extension. If the named layout file
does not exist, an error is displayed to the screen and processing terminates.
In batch mode, real-time processing is not supported due to the scrolling
vertical line style display. If a meta-file were to be generated, the result
would be the last panel displayed. However, the selected data parameters can
be processed if start time and stop time arguments are provided. In addition,
batch mode can only be used for non-interactive graphics devices, which result
in the generation of meta files that can later be printed. If the output
device selection contained in the layout file is an interactive device, an
error is displayed to the screen and processing terminates. However, the
output device that is specified in the layout file can be overridden by
specifying the device to be utilized as an argument on the command line.
For a complete list of arguments that can be utilized in batch mode, the user
is referred to the SDDAS Applications Batch Interface document.
The format that is used for plotting the data is selectable by the user. When the graphical program is invoked, a grid is displayed to the user. The user can define ("drop") any number of boxes anywhere within the grid. A box can be "dropped" by positioning the cursor arrow on the grid and single-clicking on the left mouse button. The size of the box can be adjusted by selecting the bottom right-hand corner of the box, single-clicking on the middle mouse button while dragging the corner to resize the box. Since the x-axis represents time, all boxes will be set to the same length so that the data will be time-rectified, pixel by pixel, across all plots. The white space taken up by the box represents the area that will utilized to display the data, display any labels and/or numbers that are to be drawn along the requested axes and display a color bar that will be drawn for spectrogram and spectro strip plots.
The annotation that is displayed per box is dependent upon the type of plot being displayed. For a spectrogram plot, a label is displayed along the left-hand side of the plot which describes the units along the y-axis, a color bar is displayed along the right-hand side of the plot and a label is displayed along the top which describes the units for the selected data item. For a spectro strip plot, a label is displayed along the left-hand side of the plot which describes the selected data item(s) and a color bar is displayed along the right-hand side of the plot. For a scalar plot, a label is displayed along the left-hand and right-hand side of the plot which describes the units along the y-axis and a label is displayed along the top which describes the selected data item(s). For all plot types, time is displayed along the bottom of the plot. The annotation for any of the four axes may be turned off by disabling the box margin for that axis.
While most labels can be turned off or on, there is one piece of information that is displayed no matter what the box margins are set to. This information is a timestamp, which represents the start time of the current panel being processed. This timestamp is displayed with respect to the location of the box closest to the top of the grid, centered along the top axis. The timestamp is updated as soon as the display of a new panel of data commences.
To commence the display of the graphical program, the configuration of the "graph paper" must first be performed. Once a box is placed on the grid, the type of plot for that box must be defined. This is achieved by placing the cursor within the box and single-clicking on the right mouse button. This action will bring up a menu and the menu option "Plot Type..." should be selected. If a box needs to be deleted for any reason, the menu option "Delete Box" should be selected. This action will clear the box from the grid and delete all information associated with the box in question.
Once the plot type is selected, the user may start selecting the IDFS data source(s) to be displayed for the box in question. For a spectrogram plot, only one IDFS data item can be plotted within a box. For scalar plots, up to four IDFS data items can be plotted within a box. For spectro strip plots, there is no upper limit restriction placed upon the number of IDFS data items that can be plotted within a box. However, there is a visual limitation that is imposed since the plotting space along the y-axis is subdivided based upon the number of IDFS data items selected for the box in question. As a result, the plots may become non-distinguishable or impossible to analyze. In order to select the IDFS data item(s), the menu option "Data Sources..." should be selected. This action will invoke the Data Sources GUI. On this GUI resides a list which indicates the IDFS data item(s) to be plotted for the box in question. Initially, this list is empty. To add a data item to the list, the pull-down Insertion menu is utilized. Once the position for the data item to be added has been determined, the actual data item must be selected using the IDFS Sensor Source GUI. This GUI is automatically invoked when a new item is added to the list.
The default scenario for all newly defined layouts is for real-time displays to be produced, using a time accumulation rate that is dictated by a selected IDFS data source. The data source is not defaulted; therefore, before data can be plotted, the user must specify which IDFS data source will be the source that is used to control the data acquisition period for each plotted data point. This is done by selecting the IDFS source from the list and activating the Attributes button. This action will invoke the Data Source Attributes GUI. This GUI contains the check box option This Source Controls The Timing. When this option is selected, the accumulation period is driven by the data acquisition rate for the selected IDFS data source. If more than one IDFS data source is flagged as the controller, the code simply uses the first IDFS data source on the list that has the check box option selected.
The menu option "Time..." invokes the Time GUI. This GUI is used to select whether real-time or playback processing is to be invoked. The default selection is real-time processing, with data retrieval commencing at the beginning of the data file. If playback processing is desired, the user should toggle the check box option Real-time Display and set the time range to be processed. This menu option is applicable to all boxes defined for the current layout; that is, all plots will display data for the same selected time period.
At this point, a plot can be displayed, since all other information is defaulted based upon information found in the PIDF file for the selected IDFS source(s). To plot the data, select the pull-down Actions menu from the main menubar and select the Draw option. Upon activation, the local database is checked to see if the requested data files are online. For playback processing, if data for the requested time range is not online, the graphical program will ask the user if they wish to retrieve the requested data before the plotting of the data is enacted. If the user answers yes, the data will be promoted to the local disk before an attempt is made to display the data. If the user answers no, the graphical program continues and tries to display the data, but the display will remain empty since the data is not available for processing. For real-time processing, if the real-time data file is not found on the local disk, an error message is displayed to the user. It may take some time for this error message to appear since the IDFS data access routines make numerous attempts to open the real-time data file before concluding that the data file must not exist.
The plots will be displayed on the output device selected by the user. The default selection is the XWindows device. The plot will be displayed in the box area(s) defined on the grid. If the output device selected is a bus hard-copy device, the plotting of the data will be done concurrently by another process, with the results being sent to a meta file. To change the output device, the menu option "Page Definitions..." should be selected. This action will invoke the Page Definitions GUI. This GUI contains the Output Device option list which allows the user to change the output device. This option list is not displayed when the user is accessing the graphical program from within the SDDAS viewer.
Once all the information has been defined, the information may be saved to a layout file for future retrieval. This is achieved by selecting the pull-down File menu and selecting the Save As option. The information defined is not saved by the program unless the user explicitly does so. Note that when providing the name of the layout file, do not specify the .GPH extension. The graphical program automatically appends the .GPH extension to the name of the layout file upon creation of the file.
There is some manipulation that can be made to the grid that is displayed. The GUI that contains the options for the grid can be accessed by selecting the pull-down Options menu from the main menubar and selecting the Grid option.
The remainder of this document gives an in-depth explanation of the options that appear on the various GUIs utilized by the graphical program.
This GUI contains options that control the arrangement of the boxes on the grid.
This GUI contains options that pertain to the configuration of the "graph paper", as opposed to the configuration of an individual box. These options address graphics issues, data acquisition rates and the selection of IDFS data item(s) for numeric display.
| Value | Color Table |
|---|---|
| Grayshade |  |
| Color |  |
| Earth Tones |  |
| Double Color |  |
No. Of Incremental Time Units - a scaling factor to be applied to the maximum temporal resolution for the selected IDFS data source to derive the time duration for each plotted data value or spectrum.
This GUI is used to select whether real-time or playback processing is to be invoked.
This option is useful for cases when the display is started in the midst of the data acquisition period (AOS). If the user does not wish to view all the data gathered thus far, but simply wishes to view the data from this point in time until the next LOS, the second option should be selected.
This GUI is utilized to define the type of plot that will be displayed for the box in question.
If the user changes the plot type for a box that has been defined, the list of selected IDFS data items(s) associated with that box is purged and a new list is setup for definition.
To add a data item to the list, the pull-down Insertion menu is utilized. The menu options indicate the position within the list at which the current data item definition is to be inserted. These options include:
The first two options, After and Before, indicate a position that is relative to the highlighted entry on the list. The new data item definition is either placed after or before the current position in the list, respectively. The last two options, First and Last, indicate an absolute position on the list; that is, the new data item definition is either placed at the beginning of the list or at the end of the list, respectively. Obviously, these options make sense for a non-empty list. Therefore, the first data item definition is always placed at the beginning of the list, regardless of the option selected. The position is utilized when the data is extracted and processed; that is, the data is processed in the order in which it exists on the list. Once the list contains an entry, the Attributes, Binning, Averaging and Scaling buttons become visible.
To delete a data item from the list, the pull-down Removal menu is utilized. Currently, this pull-down menu contains just one option
The Data Source button invokes the IDFS Sensor Source GUI. The Attributes button invokes the Data Source Attributes GUI. The Binning button invokes the Bins GUI. The Averaging button invokes the Data Source Averaging GUI. The Scaling button invokes the scaling GUI that is appropriate for the plot type selected.
The user must select the project, satellite, experiment, instrument and virtual instrument from which data is to be extracted, in addition to specifying the data item to be acquired and displayed for the box in question. To change any of the selected options, click on the buttons on the right hand side. Note that all lineage information under the branch being changed is no longer applicable and must be re-selected. When the data item is changed, all GUI options are reset based upon information in the PIDF file for the newly selected data item.
There are several data items that may be obtained from an IDFS data set. In addition to the primary data source (sensor data), there may be several secondary data sources attached to it which may be accessed in parallel. Secondary data sources include:
The Infer button is used to default all options based upon information found in the PIDF file for the selected IDFS data item.
When a scalar plot is annotated, an (L) or (R) is appended to this label
to indicate whether the data is plotted with respect to the left-hand side
or right-hand side of the y-axis.
The following three options are presented when a scalar plot is selected.
Once the IDFS data item has been selected, binning information must be provided for the data item. The binning information is defaulted based upon information contained in the PIDF file for the selected data item. For the graphical application, the binning scheme used for each virtual instrument selected is based upon the first data item selected from the data set. The user need not concern themselves with this information unless a change in binning schemes is desired, which can be achieved by selecting the Binning button.
Some of the vector IDFS data items return data that has a functional dependence on dimensions other than the scan dimension. The IDFS paradigm handles data that can have additional dependencies on charge, mass, phi angle and theta angle. When one of these IDFS sources is selected, the data must be reduced to a 1-D quantity that is only dependent upon the scan parameter for spectrogram plots or reduced to a scalar quantity for spectro strip and scalar plots. By specifying the ranges over which to collapse (reduce) the data, the resultant plot may actually be displaying data from multiple IDFS sensors instead of from the single IDFS sensor selected by the user. For example, if more than one IDFS sensor utilizes the same initial and final aperture elevation angles, the data for those sensors will be combined when collapsing over the specified elevation angle range. The Infer button is used to default all averaging options based upon information found in the PIDF file for the selected IDFS data item.
![[Straight Average Equation]](pics/str_avg.gif)
![[Straight Integration Equation]](pics/all_str_int.gif)
where the range is defined by the volume integral, dΘ is the polar angle increment, dΦ is the azimuthal angle increment and ds is the scan variable increment. Note that angular measurements are converted to radians when producing the final answer. The reduction over the scan variable is only performed when a scalar plot or spectro strip plot is being produced.
![[Spherical Integration Equation]](pics/all_sph_int.gif)
where the range is defined by the spherical volume integral, Θ is the polar angle with increment dΘ, dΦ is the azimuthal angle increment and ds is the scan variable increment. Note that angular measurements are converted to radians when producing the final answer. The reduction over the scan variable is only performed when a scalar plot or spectro strip plot is being produced.
![[Flux Integration Equation]](pics/all_flux_int.gif)
where the range is defined by the spherical volume integral, Θ is the polar angle with increment dΘ, dΦ is the azimuthal angle increment and ds is the scan variable increment. Note that angular measurements are converted to radians when producing the final answer. The reduction over the scan variable is only performed when a scalar plot or spectro strip plot is being produced.
The hemisphere assumption factor is dependent upon the dimension being processed
and the scheme (method) selected in order to reduce the dimensionality of the
data. The hemisphere assumption factor is not selectable by the user. The
hemisphere assumption factors were obtained for each method assuming angular
isotropy. The table below summarizes the values used for assumption factors
during processing:
For a spectrogram plot, the user may wish to plot the sweep of data
associated with the selected data item. To do this, the user should select
the No Average averaging method and select the
Off Status option for all listed dimensions.
DIMENSION
STRAIGHT INTEGRATION
SPHERICAL INTEGRATION
FLUX INTEGRATION
CHARGE
n / a
n / a
n / a
MASS
n / a
n / a
n / a
PHI
n / a
2 pi
2 pi
THETA
n / a
1
0.5
SCAN
n / a
n / a
n / a
Based upon the plot type selected for the box in question, one of three scaling menus will be displayed: (1) Spectrogram Axes Scaling , (2) Scalar Axes Scaling and (3) Spectro Strip Axes Scaling. All three GUIs contain options that control the configuration of the box. The user may change the scaling of the axes and the display of labels to name a few of the controllable graphics issues. The Infer button is used to default all options based upon information found in the PIDF file for the selected IDFS data item(s).
For color bar information, the information retrieved from the PIDF file is based upon the selected Data Unit. For y-axis information, the information retrieved from the PIDF file is based upon the selected Scan Unit.
The Scalar Axes Scaling GUI has two sets of options to be answered, one for the left-hand side of the y-axis and one for the right-hand side of the y-axis. When a scalar plot is selected, up to four data items can be plotted within a single box. One of the options on the Attributes GUI defines which axis (left-side or right-side) the data is to be plotted against. If all data items are to be plotted against the same axis, options on the scaling GUI will be shaded out for the axis that is not applicable. However, if data is to be plotted against both axes, both sets of options are displayed. In either case, the scaling options are "shared" by all data items defined for the box in question. Any change made to a scaling option for a particular axis, with the exception of Science Min and Science Max, affects all sources plotted against that axis. When the data items are split between the two axes, the user may define different scaling schemes for the left-hand and right-hand side of the y-axis.
As an example of relative scaling, consider the following: an IDFS data item returns data in the range of 100 to 200. Using the default relative scale of 1 to 10, the value 100 is mapped to 1 and the value of 200 is mapped to 10. Any value returned between 100 and 200 is mapped to a value between 1 and 10 before being plotted along the axis.
When a spectro strip plot is selected, any number of data items can be plotted within a single box. The scaling options for the box in question are "shared" by all selected data items. Any change made to a scaling option, with the exception of Science Min and Science Max, affects all sources plotted within that box.
To add a data item to the list, the pull-down Insertion menu is utilized. The menu options indicate the position within the list at which the current data item definition is to be inserted. These options include:
The first two options, After and Before, indicate a position that is relative to the highlighted entry on the list. The new data item definition is either placed after or before the current position in the list, respectively. The last two options, First and Last, indicate an absolute position on the list; that is, the new data item definition is either placed at the beginning of the list or at the end of the list, respectively. Obviously, these options make sense for a non-empty list. Therefore, the first data item definition is always placed at the beginning of the list, regardless of the option selected. The position is utilized when the data is extracted and processed; that is, the data is processed in the order in which it exists on the list. Once the list contains an entry, the Attributes and Binning buttons become visible.
To delete a data item from the list, the pull-down Removal menu is utilized. Currently, this pull-down menu contains just one option
There is an upper limit of three IDFS data items that may be displayed numerically along the x-axis. In addition, there is a restriction that the data must be a scalar quantity. If a sweeping instrument is selected, all data types except sensor data can be selected for display.
The Data Source button invokes the IDFS Sensor Source GUI. The Attributes button invokes the Data Source Label Attributes GUI. The Binning button invokes the Bins GUI.
The Infer button is used to default all options based upon information found in the PIDF file for the selected IDFS data item.
This GUI contains options that define the axes to be annotated for the box in question.
The default scenario is to allow all axes to be annotated.
This GUI contains options that modify the grid that is displayed.