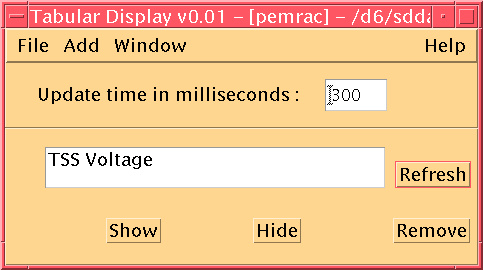

The tabular display program is mainly meant for real-time data analysis, but can be used for playback as well albeit not real efficiently. The main reason for this is the use of X events to generate events on when to update the display.
This might be changed in a future version.
Tabular's main function is to display IDFS data simply. The display's that tabular employs are very basic number dumpings which can be useful for engineering data/anaylsis.
However, almost any single IDFS data source display may be integrated into tabular with little effort making the program extensible should needs change.
The first thing to decide is which type of display you wish to use. Currently, six displays are available from the "Add" button:
After you have picked a display type, pick a data source by RIGHT clicking on the line seperating the display and the textfield. Yes, its a small line, but that may change soon.. The source dialog will pop up. Choose the source by selecting through the standard source and time dialogs. If you want real time, there is a check box below that must be checked. If not, unclick it and select the time. Units must also be selected for sources which have units applied to them. Click OK. Now, if you wish to add more displays, follow the same procedure for them. When you have completed adding displays, go to "Window"->"Go". Data will start accumulating at the rate specified in the "Update Time in Milliseconds" field. Go to "Window"->"Stop" when you wish to stop displaying data.
Data is collected at a constant rate. Set the update time to the LOWEST sampling rate. This only applies to real-time data analysis and make no "real" difference in playback.
Each display is a different shell which can be iconified and deiconified at will. Updates will still take place on an iconified shell. Each shell also shares some common attributes. The first of which is the layout. A shell consists of a title field, an OK button, and a "widget" (which is basically the graphical display).
If you type into the title text field and click OK, the window / icon title will change. You must click OK or press RETURN for the change to take place.
Below the text field is a line seperator with a light square on the right side. This allows the text field to go away should you need the extra space for the widget. Simply click and drag on the square to resize the widget display area. You can go all the way to the top if you wish to make the title area disappear.
The line seperator also has a dual function. If you right click on the seperator, a popup menu appears with three functions:
The source / time dialog will appear if you select "Source/Time". From here, you can change the source and time values. Click on "Source" and the standard source dialog will appear. Click all the way through it and select OK. The source will appear on the dialog. Next, you may want to select "Units" and select an appropriate unit. Finally, if you are working in real time, you are done. If not, uncheck the "Real Time" check box, and select "Time". The standard time dialog will appear. Enter the time and select OK. After this, you are complete. Click OK.
For limits, certain displays have the concept of a limit built into them. Currently, XY Plot, Byte LED, and Text Box do not. Furthermore, the limits display is different for the Dial, Bit LED, and the Oscilloscope.
The restart makes this single display "restart" itself by reopening the data stream. If the stream has terminated, no new data will show.

The main window consists of three major parts: the update time, the display window, and the buttons along the bottom.
The display window will show all available displays currently defined. The item in the window is the assigned title. The other items are discussed below.
The show button will bring the selected window to the front and deiconify it.
The hide button will take the selected window and iconify it.
The remove button will take the selected window and delete it.
After you have changed the titles of the particular displays, click "Refresh" and the titles will change in the display list.
Click on the Add button to add a new display to the view. The following displays are available:
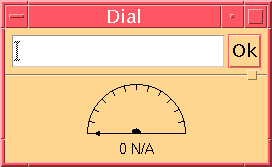
The Dial display is a voltmeter looking device. It can be resized and shrunk at will to make a different type of display. Unfortunately, the text represented along the bottom will remain a constant size.
For the Dial display, the limits display is as follows :
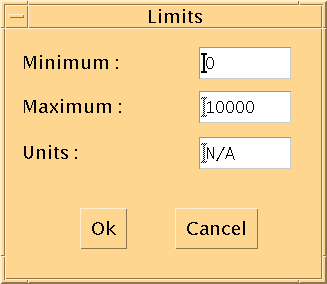
The minimum and maximum are the upper and lower bounds of the widget. The units are the units which you wish the dial meter to be displayed in. Click OK to save changes and the widget display will update accordingly.
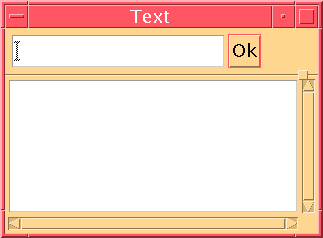
The text box is a just a place where numbers will be dumped. It makes no checks or anything. Just a running display of the numbers produced.
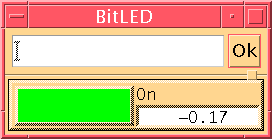
The bit LED has three locations where information is displayed. The first is the large box where a different color is shown. The color can be anything in the rgb.txt file usually found in /usr/openwin/lib/X11. It is defined in the limits dialog shown below. The other locations are to the right of the box. The top one is a label which is also defined in the limits dialog. The other is a text field where the actual value is displayed. The LED can be resized, but only the color box will actually take advantage of its newfound space.
For the Bit LED display, the limits display is as follows :
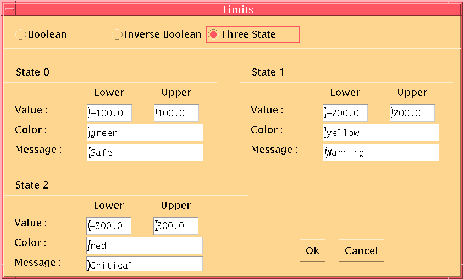
There are three buttons along the top: Boolean, Inverse Boolean, and Three State. Each of these buttons are essentially quick setup buttons to quickly change the values of the rest of the limits dialog. All numbers are entered as floats.
The boolean means set state zero to value of zero. Likewise, the value of state one is one. The colors are by default green for state one and black for state zero. Inverse boolean simply reverses these and makes state zero the value of one and state one the value of zero.
Three state is slightly different. Each upper and lower value is a range of values for which the display will show the given state message/color. When the value goes into another range, the color and message will change. Furthermore, the range can be a window and the next range can envelope that window. For example, the range for the first one can be from -100.0 to 100.0, while the next one can be from -200.0 to 200.0. The second range includes all in the first range, but will show up as different color. You can also set range one from -100.0 to 0.0 and range two from 0.1 to 100.0.
The booleans can be useful when an instrument goes on and off or only has two states. Three state has a wide range of uses such as seeing when an instrument needs attention.
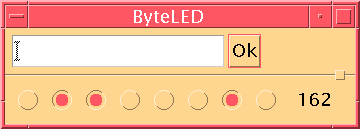
The Byte LED will show 8 bits of data by breaking up a 8 bit word and if the bit is set, it will show a colored light. Otherwise, it will be clear. The display also has the hexadecimal value to right of the bits display.
There are no limits for the Byte LED display
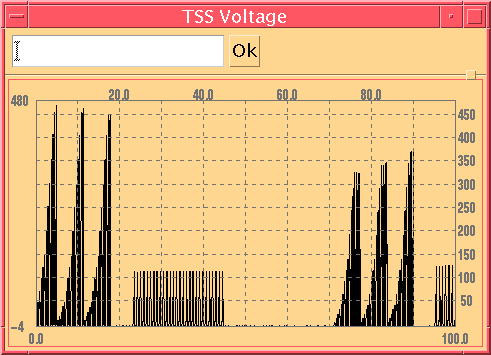
The Oscilloscope display is one of the most complex displays within Tabular. It has a variety of options to refine/limit the plot. To get to these options, right click on the widget display (not the little line). From there, you can change the scaling, the graphics, the range, and many parameters of the grid display.
Rubber banding is also available on the oscilloscope by clicking inside the display. If you need to know a point in the oscilloscope and your range is correct, you can see exactly what point a peak is at by clicking on it. Two blue lines will help pinpoint the location and these bands can be dragged around with the mouse.
For the Oscilloscope display, the limits display is as follows :
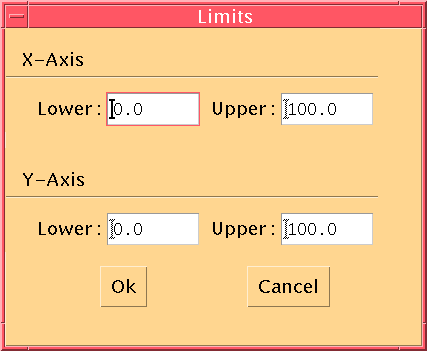
You can enter an upper and lower range on the X axis, but your plot will not change. If you change the range on the Y axis (also available by right clicking on the display and selecting Range), the plot will change and replot based on the new limits.
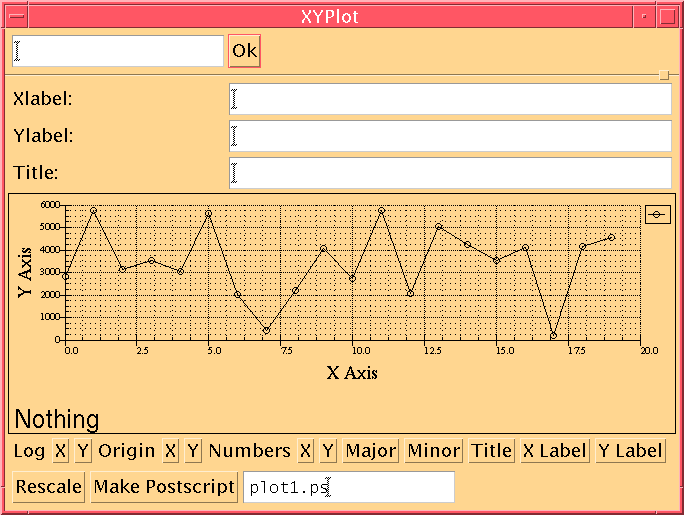
The XY Plot will show data coming in on a Cartesian coodinate system. The Y axis is the dependent axis and may be defined to any source. The X axis is merely its position in time. By default, twenty points are available on the plot.
There are many things that can be changed for the XY Plot. All the titles / labels can be changed by typing into the appropriate textfield. There are also buttons along the bottom:
There are no limits for the XY Plot display.
This program could not have been written with the help of some free widgets which were picked off the net. The ones used in this program is SciPlot v1.36 by Robert McMullen. It is available at http://www.ae.utexas.edu/~rwmcm/SciPlot.html
Another widget, the oscilloscope widget, was kindly donated by Travis Wood of Computer Sciences Corporation.
Portions Copyright (c) 1996 Robert W. McMullen
Portions of the SciPlot Widget source code, as marked, are: Copyright (c) 1993 Alan Richardson (mppa3@syma.sussex.ac.uk)