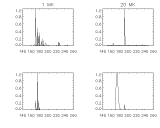

Calculated response of the TRACE 171 A channel for two temperatures, 1MK (left) and 20 MK (right). The upper plots show the spectral distributions as obtained from MEWE_SPEC, a program that tabulates the X-ray emission lines and the continuum, and the lower plots the same spectra after multiplication by the 171 A spectral response function. Both sets of plots are normalized to unity. The large bump in the 20 MK plot probably shows continuum modified by the multilayer reflectivity maximum. If this is true, then in situations where the DEM is dominated by high temperatures, TRACE will image these regions to 1" resolution! This wonderful news was described in detail in "On the Ability of an Extreme-Ultraviolet Multilayer Normal-Incidence Telescope to Provide Temperature Information for Solar Plasmas," Feldman et al., 1999 ApJ 511, L61.