The relationship between flares and coronal mass ejections (CMEs) is still a hot topic, though flares tend to get forgotten during solar minimum. It is well known that a CME can indeed occur in a quiescent region without leaving strong X-radiation. But there are many CMEs that are clearly associated with major flares and these CMEs are generally fast, and therefore of importance to the Sun-Earth connection. This week's nugget deals with a CME-associated flare observed by Yohkoh and TRACE. It is our surprise and disappointment that only a handful of flares have been observed jointly by the two satellites.
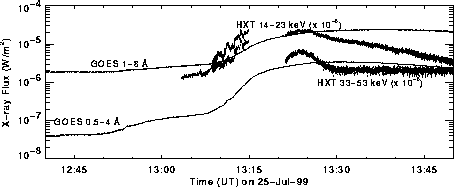
The flare occurred in AR 8639 (at latitude of about N35) as it reached the west limb. In earlier days, the often-mentioned sigmoidal shape was not clear in SXT images. The plot below (click to enlarge) shows X-ray light curves of the event. The gap of the HXT light curves (08:14-08:21 UT) coincided with data downlink at a DSN station.

We first see a movie of SXR quarter-resolution (summed pixel size 9.86") images, which shows plasma ejection most pronouncedly in the direction of 2:30 or so (westward, slightly to north). The color table is inverted. These images are heavily saturated (so that we can see diffuse emission), but the central part is replaced with full-resolution images which don't show much saturation. Note that ejection was seen only before 13:14 UT, i.e., before the data gap. The presence of X-ray ejection limited to the early phase of flares was also noted by Shibata et al. (1995) in ApJ Letters.

As expected, a CME was seen by LASCO . In each panel of the figure, the circle corresponds to one solar radius. So does the ejection we see in SXT images directly translate to the front part of the CME? The answer may be yes in this case, but that is not all.
Although SXT did not start observation until 13:09 UT after spacecraft night, TRACE observed this region from a much earlier time. In the following, a short TRACE movie is shown. Note that the flare was not observed in the best condition. Indeed, the flare sequence made the pixel size as large as 4", so the images do not look quite the same as we are accustomed to. Also, some images are contaminated with particles. Even so, these data tell us a lot about how the CME initiated. Here is a movie in 171 Å (click the thumbnail). These are made in the same field of view as the SXT movie.

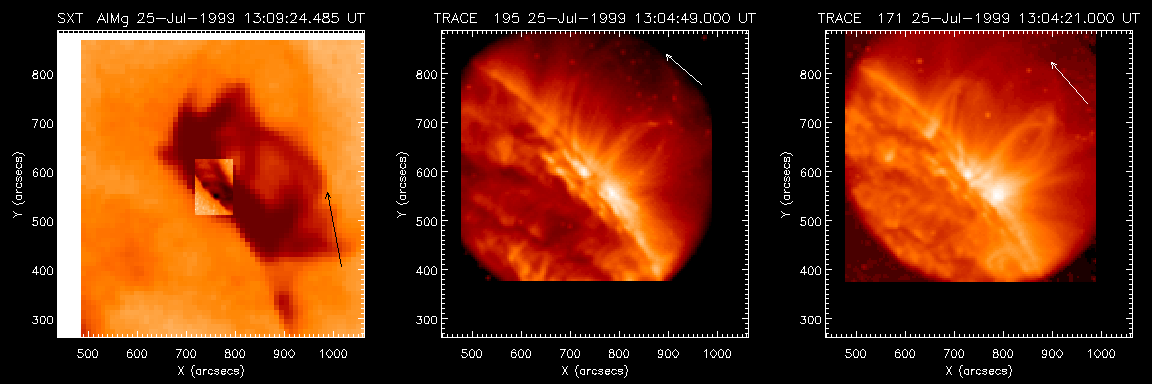
We note that loops started moving outward as early as 12:44 UT, and that the outermost loop was almost at the edge of the image at 13:14 UT. This outermost loop may have become the CME front, and it was also seen in 195 Å images. Movies at 195 Å and 1216 Å are are also available. In 1216 Å images, the footpoints of the expanding loop brightened already at 12:54 UT. As a summary, each of the following images show the most prominent ejection.

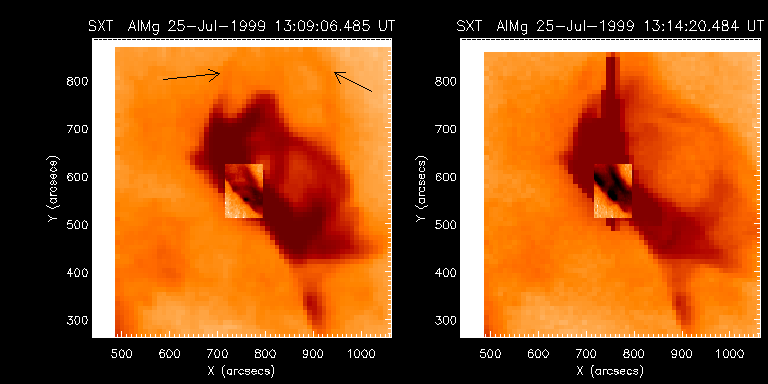
We see that different structures are pronounced at different wavelengths or in different pass bands, although it is likely that a same loop is seen at 195 Å and 171 Å. Therefore, a conventional height-time plot like this may be misleading, because we may not be discussing the same structure. Nevertheless, this plot shows that both EUV and X-ray ejections or expanding loops get accelerated (to about 300 km/s) around 13:10 UT, i.e., during the early impulsive phase of the flare (see the light curves given above). It is likely that both expanding loops contributed to the frontal loop of the CME, which does not appear to have a simple shape. The speed of the CME is around 1100 km/s. Moreover, even in SXT data alone, there are multiple expansions. For example, in the following figure (click to enlarge), the loop pointed by two arrows in the left image is no longer visible in the right image.

So the bottom line of this analysis is this. A CME can be a complicated phenomenon and it can consists of multiple components. Both cool plasma (as seen in TRACE images) and hot plasma (as seen in SXT images) may have contributed to the frontal loop in this particular case. Expansion of the cool loops started tens of minutes before the onset of the flare, and even in SXT images there is an indication that diffuse loops had already started expanding toward north. Without high time resolution observations, we would be happily stuck with a simple model, but we want to do better.
11 September 1999: Nariaki Nitta (nitta@lmsal.com)