|
|

|
Here "variability" means the energy output of the Sun as a star - the solar energy flux (total irradiance) varies, and the variations spread across the whole spectrum. The Yohkoh SXT's camera contains a million pixels, of course, so for this star at least we can resolve the sources of the X-ray variations in detail. People are working on that, but this science nugget just contrasts the variability of the total X-ray flux with that of seen in visible light (the quantity quaintly called "the solar constant" in a bygone era).
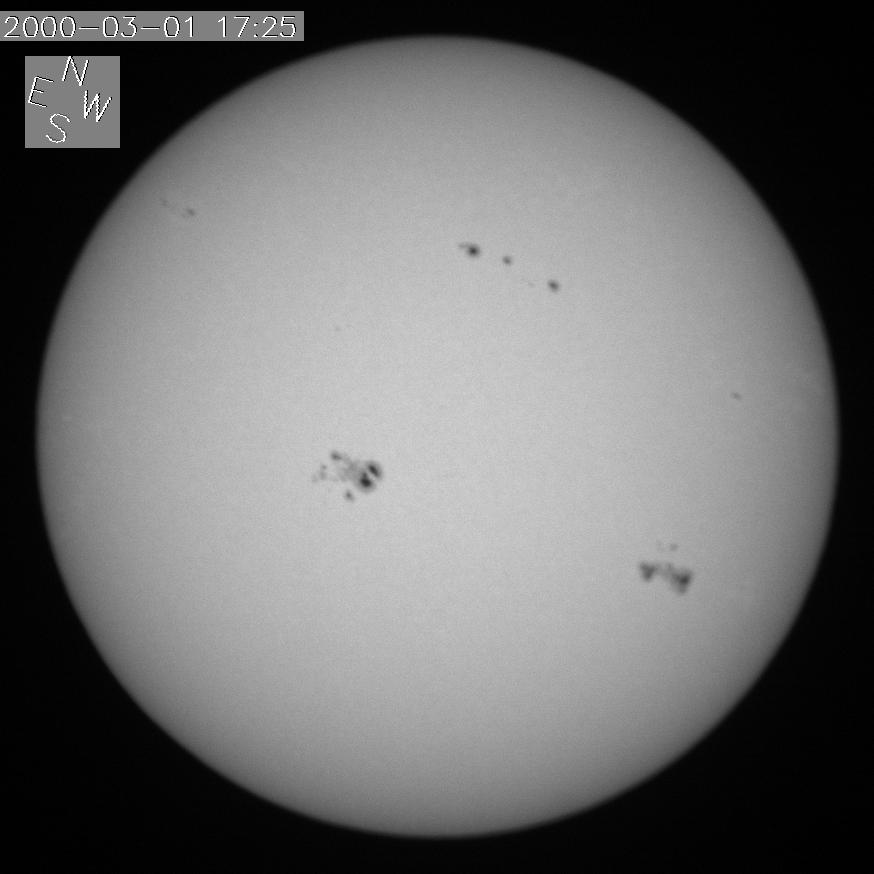
The radiant energy from the Sun does not actually vary by much. That's consistent with the nearly featureless appearance of the photosphere, to a casual glance. The first telescopic views of the solar surface showed the common presence of sunspots, and these indeed produce the largest identifiable variations in the solar constant: much less than one percent.
In X-radiation - a minor feature of the solar spectrum, arising in the tenuous corona - things are entirely different. The variability can be huge: in the SXT band, many factors of ten. For hard X-rays and gamma-rays, the natural emission of the Sun must be close to zero, and the minimum brightness would be set by cosmic-ray albedo somehow. The total variability for gamma-rays at one MeV might be a factor of 108 or so, and if one could make an image of the sky at such a wavelength, the Sun would normally be as dark as the Moon, darker than the background radiation from the rest of the universe. An eclipse would be completely unspectacular. But we digress badly.
The easiest way to characterize solar variability is simply to look at representative images. We pick March 1, 2000, because of its high activity:
|
|
|
We could show actual total-irradiance data directly. There are excellent observations from SOHO and now from ACRIMSAT too. But instead we'll show synthetic "light curves" derived from the sunspot observations and explain how we made them. The calculation of the "photometric sunspot index" (PSI) simply takes the projected area of each spot group, as tabulated by many solar observatories around the world, and determines its effect on the solar intensity observed in the direction of the Earth by adopting average values for sunspot umbra fraction and effective temperature. Radiative-transfer effects, which cause the solar "blackbody" radiation actually to be highly anisotropic, get treated in the most cavalier fashion.
The PSI function, simple as it is, "explains" a large fraction of the variance of total irradiance. We illustrate this with a three-month data interval from 1996, the time of the "last best active region of the old cycle", which produced an X-class flare in the abyss of solar minimum:
There are several interesting things here. First, the PSI model doesn't show all of the observed fluctuations. That's partly because it depends upon sunspots being there, but this is a three-month period during solar minimum - sometimes no spots! Second, the first apparition of the July spot group correlated well (spots on the solar central meridian about July 10), but the second didn't (same group of spots on the central meridian about August 1). Spots are black, so PSI can only model the negative excursions; the faculae dominate the positive excursions but aren't in the PSI model.
The main interesting thing about these time series is, however, the small amplitude. The zero for the Y-axis is (deeply) suppressed. Thanks to this relative stability, we can have a tranquil climate on the Earth.
Loosely, but certainly. The plots below show the PSI-modeled sunspot irradiance effect for the first three months of 2000, plus the GOES soft X-ray flux for the same period.
One can see striking similarities but intriguing discrepancies. The huge PSI "dip" on March 1 resulted from the simultaneous appearance of two mammoth sunspot groups, each larger than 1,000 millionths of the hemisphere in area (a standard measure). These spots were not duds as regards X-ray and flare production, but they were not spectacular - only one X-class flare on March 2 from only one of the two large groups.
Here the main effect to notice is the amplitude of the X-ray plot. It is a factor of 15 over these three months; actually much larger with finer time sampling than one-day averages; actually much larger still because this time interval is too short to reveal the 11-year solar cycle. So... the variability of the Sun looks very different at the short-wavelength extreme end of the spectrum.