
Source Properties: Photometry
Fig. 1 plots source magnitude distributions within the XMM-OM SUSS, separated by filter. Only those sources with no quality issues are included.
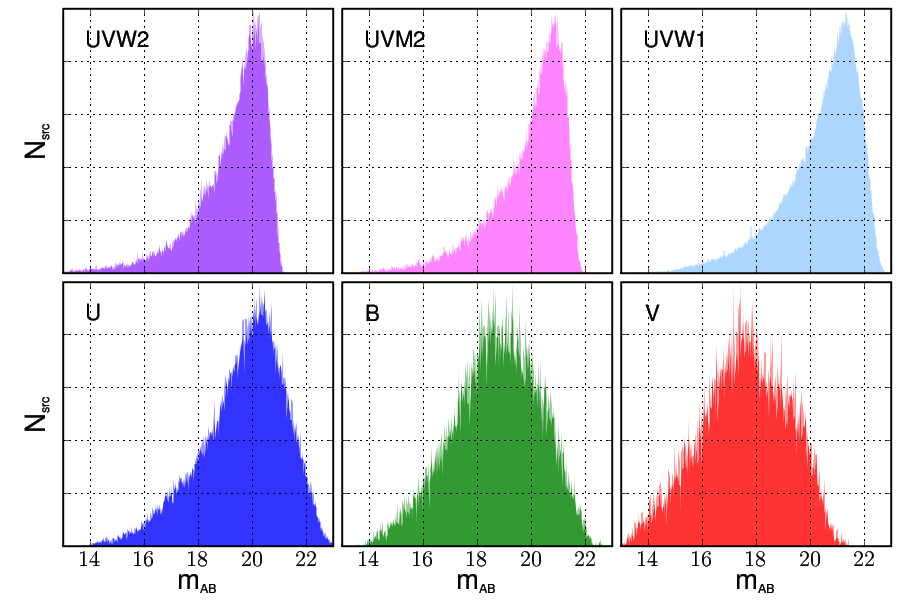
Figure 1: The normalized magnitude distributions of quality = 0 sources with detection significances > 3σ contained within the XMM-OM catalogue.
The dichotomy between UV and optical distributions is partially the result of the differing criteria by which these sources are selected for inclusion in the catalogue. All UV detections > 3σ are catalogued, whereas only optical sources with a UV-counterpart > 3σ are selected for inclusion. However spectral energy also makes a contribution to the optical distributions. Our selection criteria naturally favour blue sources. Both the absolute number of detections and the characteristic magnitude of sources decrease as our optical filters increase in wavelength.
Unlike the sharp, artificial cut-offs displayed by the source significance distributions at the low-brightness end, the UV faint-magnitude distributions cut off more gradually and this is the consequence both of non-uniform exposure lengths and time-variable background levels, resulting in a range of image depth.
Comparing the depth of the XMM-OM catalogue with the GALEX All-sky Imaging Survey (AIS) reaching mAB = 20.5 in the NUV filter, the two samples are complementary, the OM data adding more detailed spectral information to existing GALEX fields (Known Issues).
Photometric Accuracy
Throughout the mission, XMM-OM photometry has been calibrated against IUE and HST STIS UV spectrophotometric standards, and Stetson optical source magnitude measurements in the Landolt standard field SA95. Figure 2 provides a comparison of optical XMM-OM and Stetson photometric meaurements from this field over four epochs. Two-colour corrections have been performed on the OM data to adjust magnitudes to the Johnson B and V bandpasses using the onversion coefficients (XMM-SOC-CAL-TN-0019) supplied within the XMM calibration layer. Since UV calibrations are performed against spectrophotometric stars rather than standard fields, a similar UV filter plot cannot be made, but a quantitative description of the UV photometric calibration is provided in XMM-SOC-CAL-TN-0019.
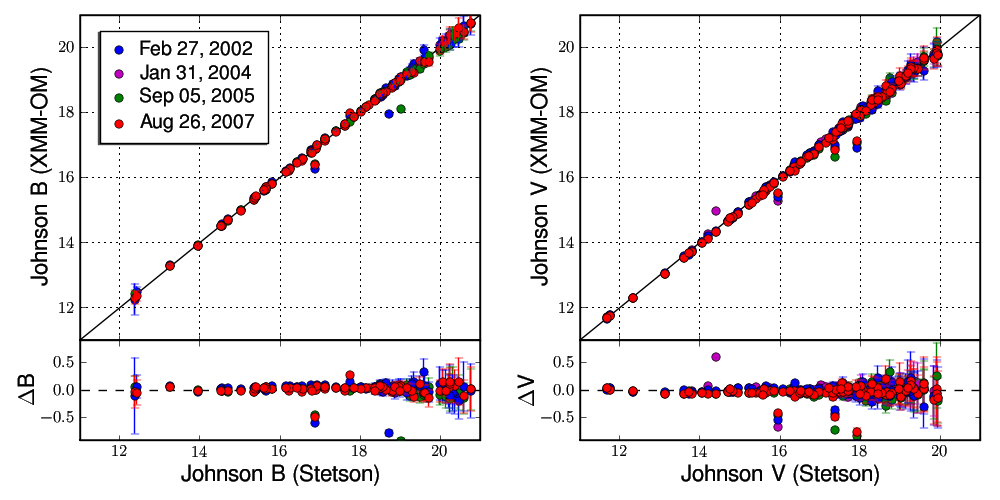
Figure 2: Comparison of XMM-OM and Stetson source magnitudes in the Landolt standard field SA95. XMM-OM magnitudes have been colour-corrected to the Johnson filer system. Lower panels provide the difference between the two measurements. XMM-OM sources were detected over four separate epochs.
Photometric Stability
Since multiple images of the same field are often obtained in quick succession, we can, neglecting rapid variable objects, characterize the accuracy of OM photometry by comparing the magnitude of a sample of sources over time. As a function of AB magnitude, Figure 3 displays the variance, σ, relative to the median magnitude of sources detected more than once during a pointing sequence.
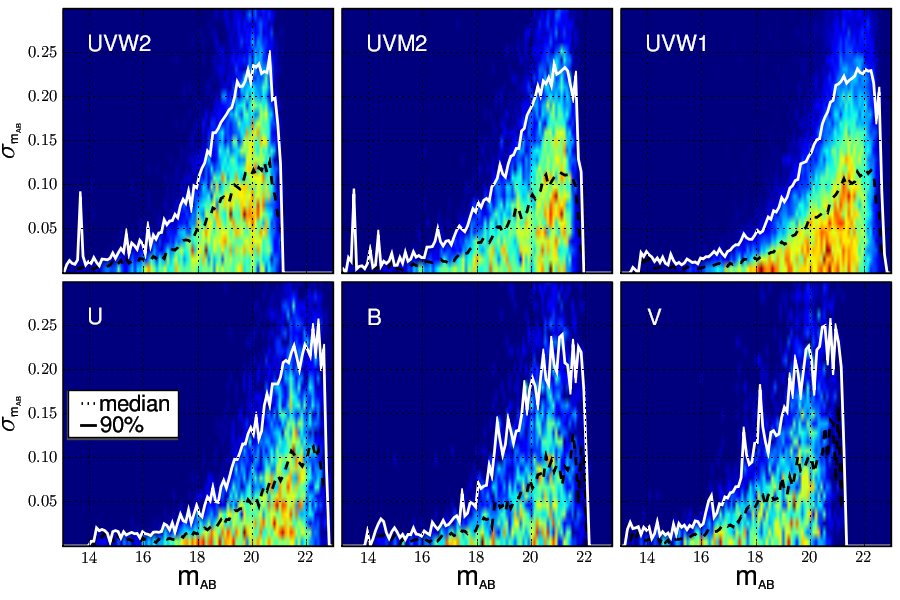
Figure 3: The distribution of RMS variability between individual source detections and AB source magnitude. The dashed line is the median RMS variation, computed with a resolution of mAB = 0.1. 90% of all source lie below the solid line. Only sources with no quality flags are represented. The colorscale is linear.
Figure 4, compares the variances of sources detected more than twice during a pointing sequence with the mean of the magnitude errors provided by the OM aperture photometry algorithm performed within the SAS pipeline. The good agreement between statistical variability and calculated error is an endorsement for the photometric quality of the catalogue.
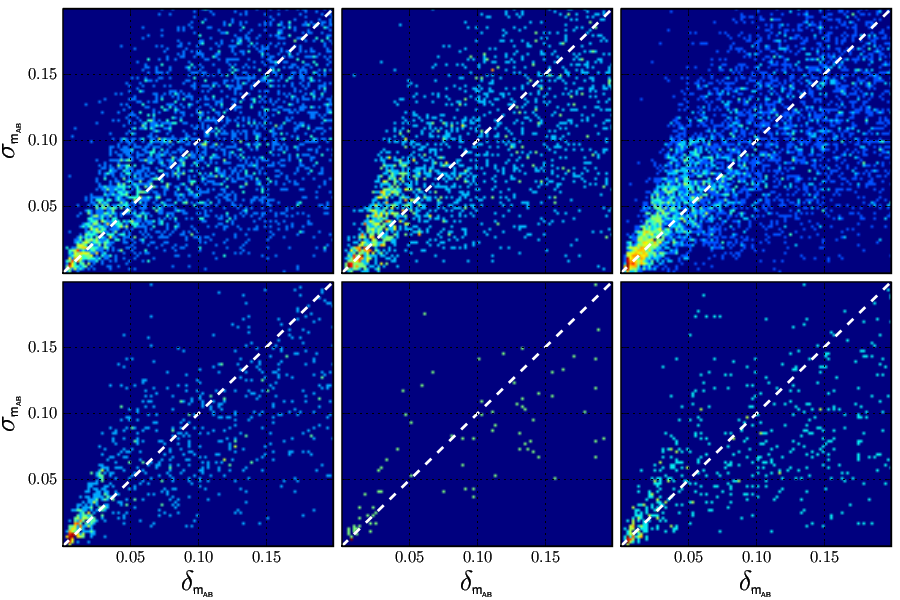
Figure 4: A comparison of the computed 1σ magnitude errors and the RMS variation of multiply-detected sources. 90% of sources lie below the solid line, calculated over a resolution of mAB = 0.01. Only sources with no quality flags are represented. The colorscale is logarithmic.