Figures for the uv grism : nominal mode
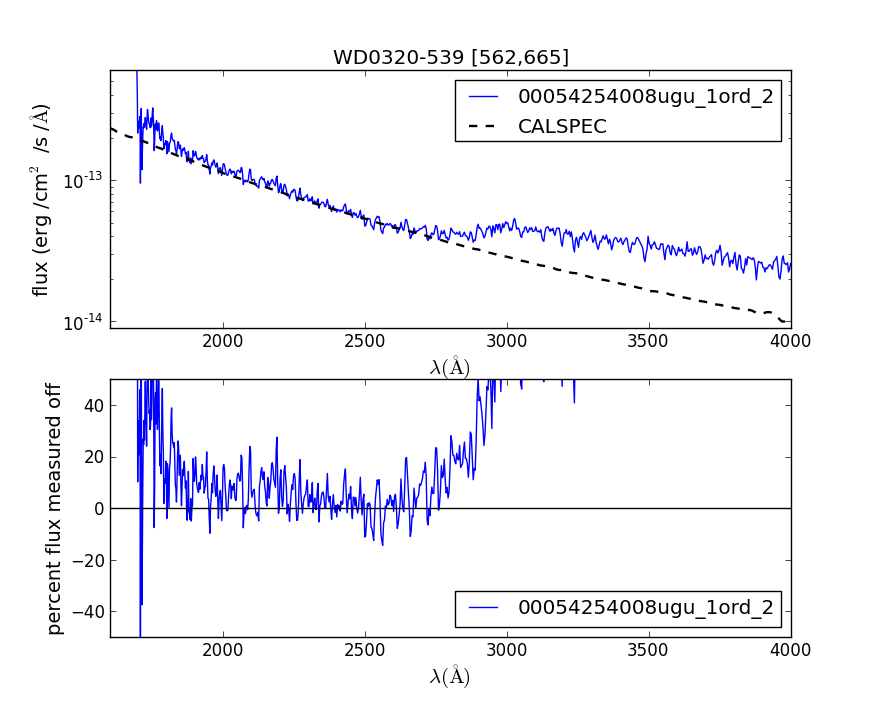
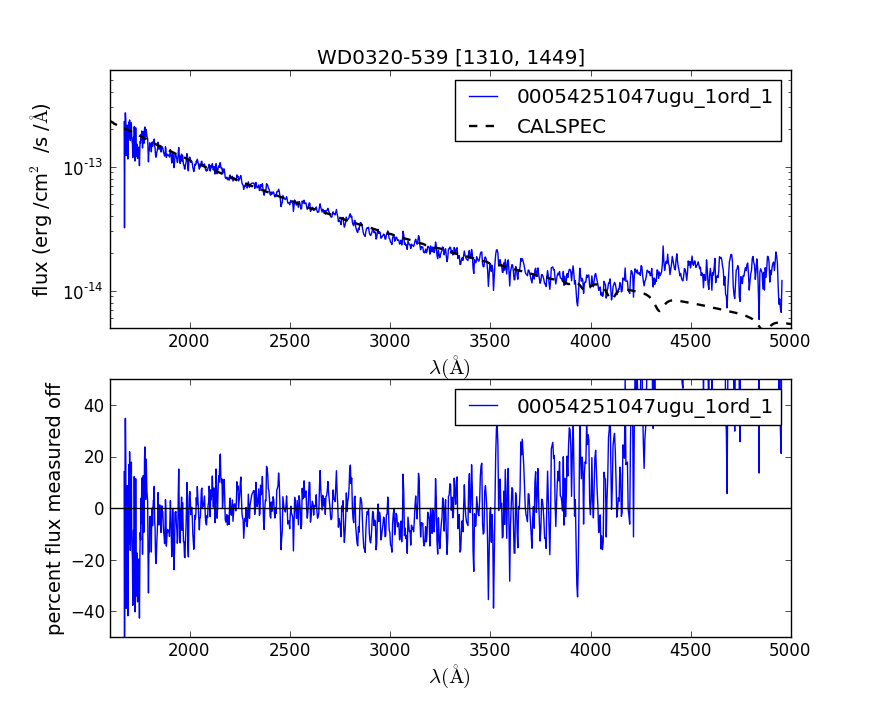
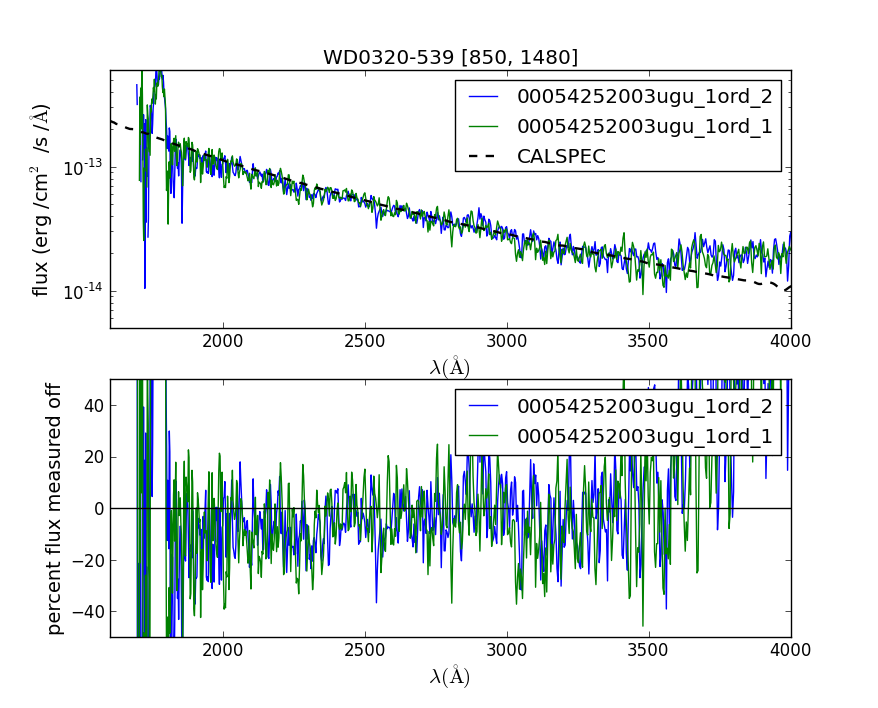
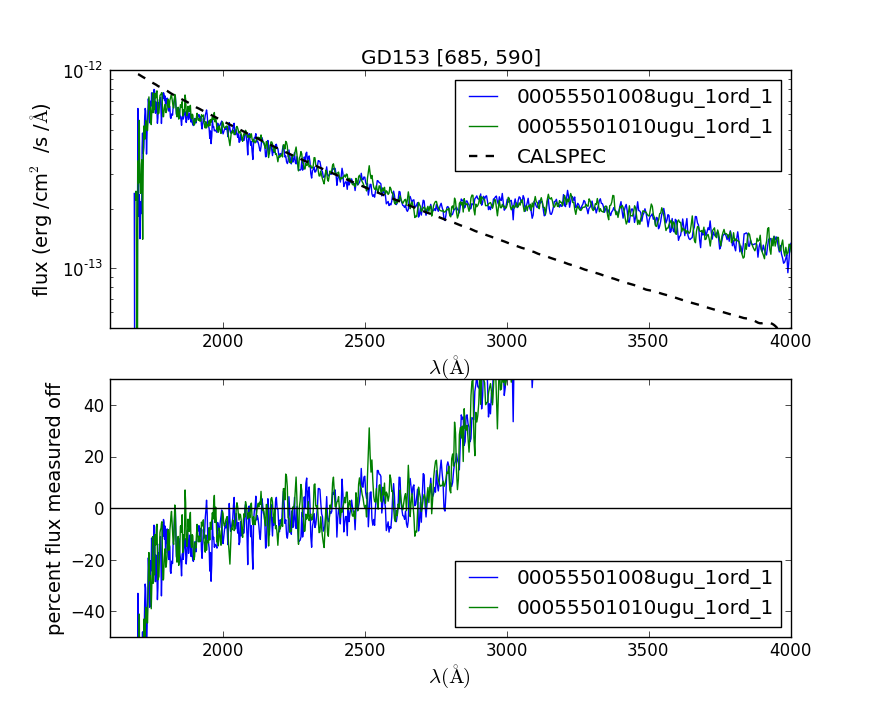
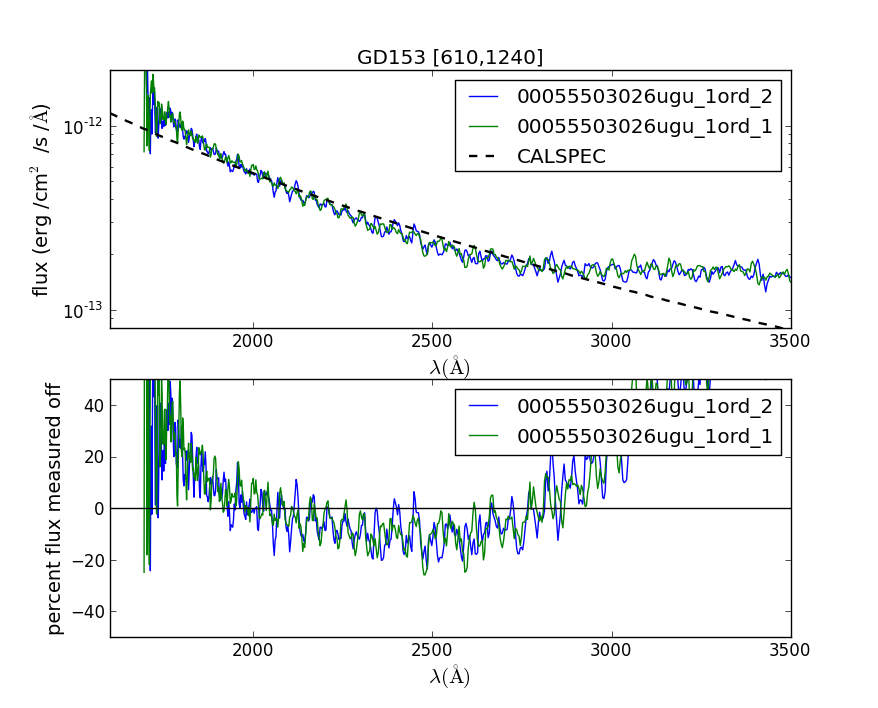
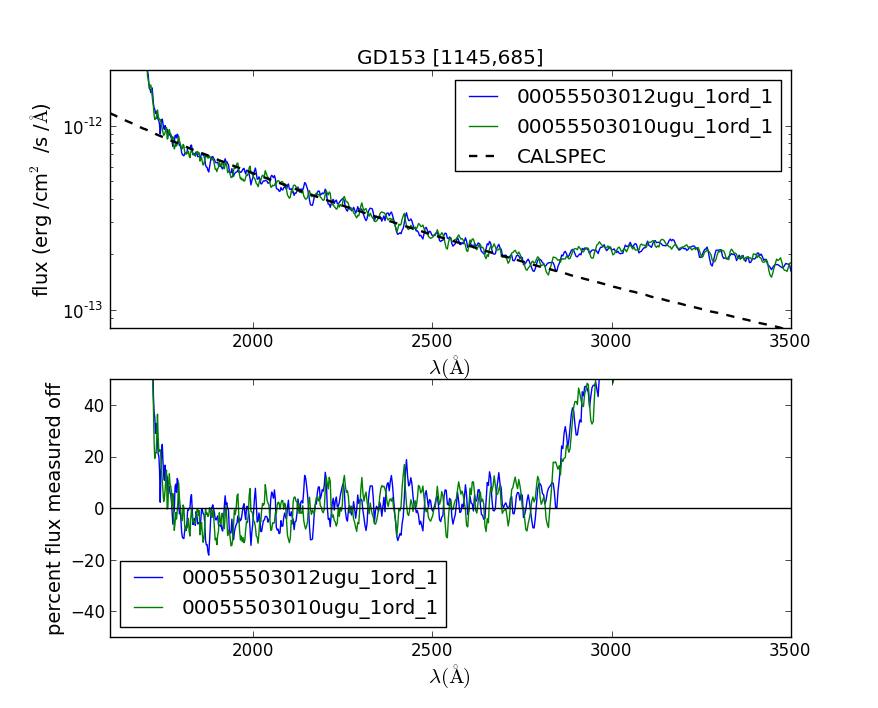
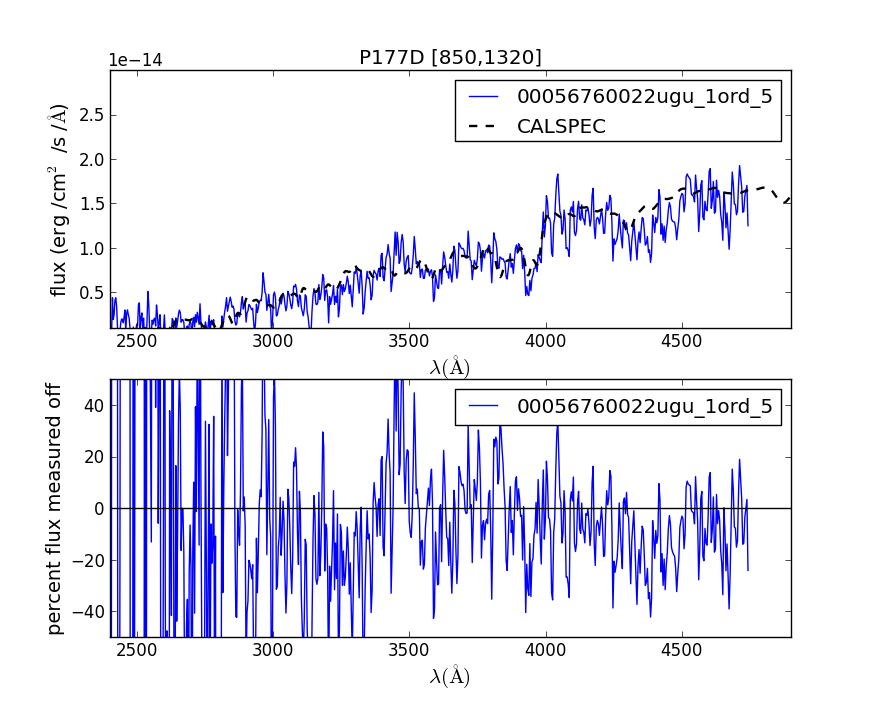
These figures go with the description Verification of the flux calibration in the UV nominal grism, and show in the top panel the observed flux and the reference spectrum which is usually taken by HST.
In the bottom panel is plotted (observed - reference)/reference as a percentage. Notice that the bottom plot gets very noisy when the source flux is low. This is due to noise in the data. Also, at longer wavelengths second order contamination raises the observed flux, setting in at a wavelength that depends on the location of the blue rise of the spectrum.
GSPC-P041C spectra (F0 V)
There are some zeroth orders from field sources present in some of the spectra; easily identified since they show up as a large peak being different from the reference spectrum.
GSPC-P041C Figure 8
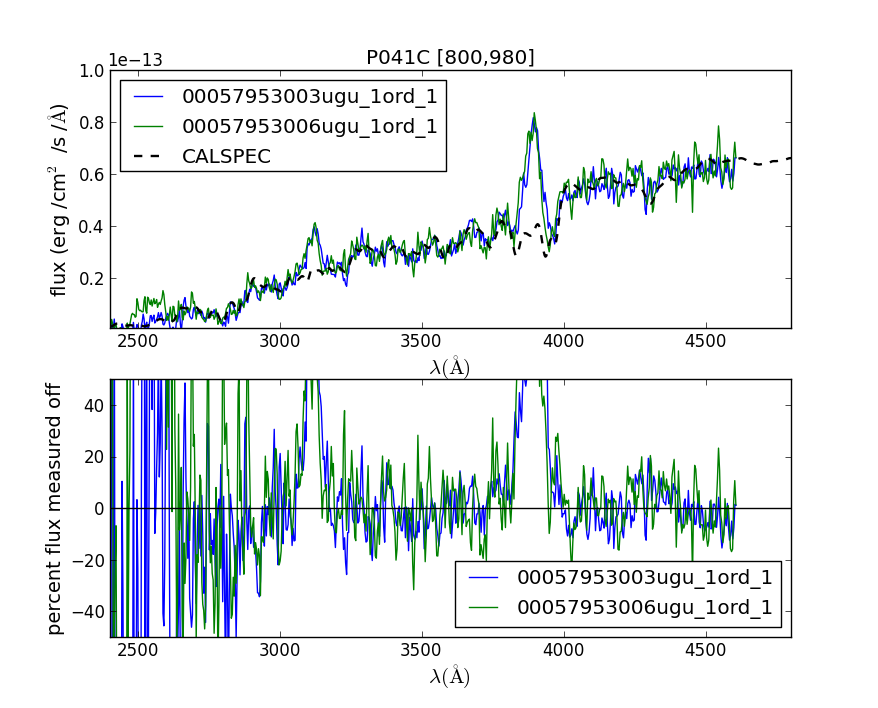
This spectrum with anchor at [800,980].
GSPC-P041C Figure 9
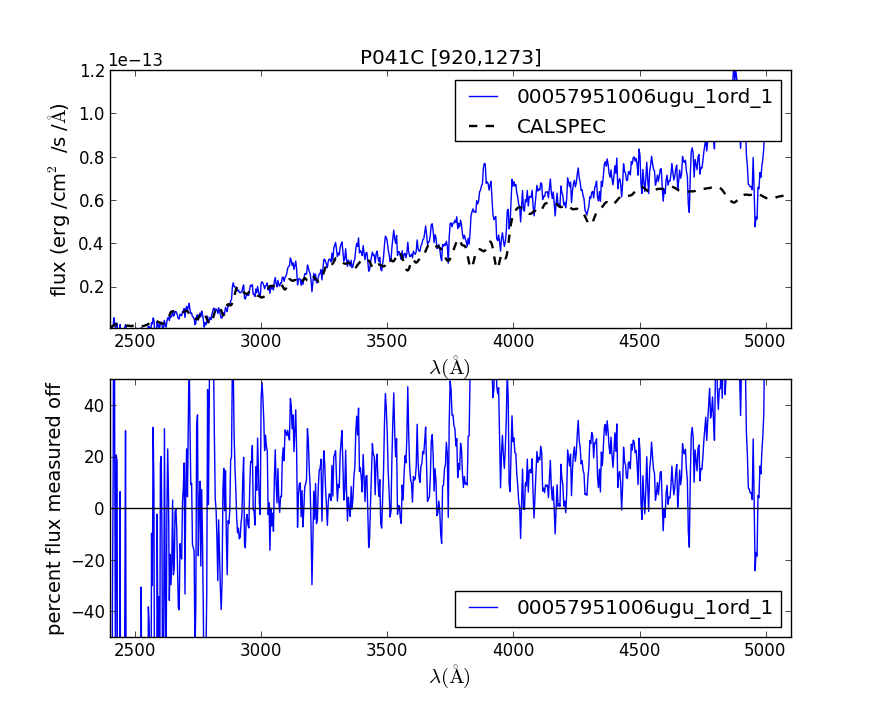
This spectrum with anchor at [920,1273].
GSPC-P041C Figure 10
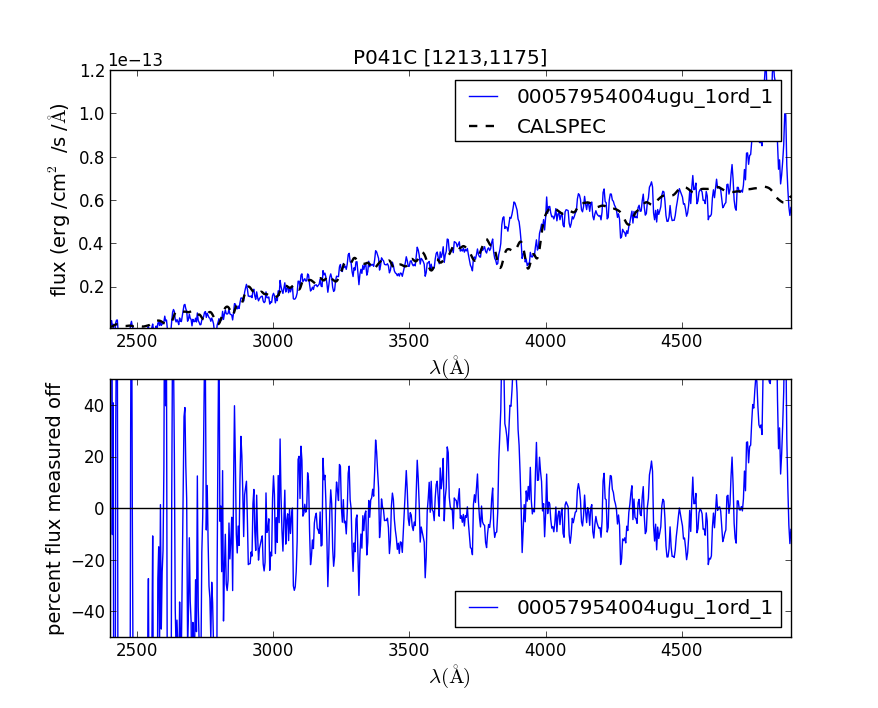
This spectrum with anchor at [1213,1175].
WD1057+719 spectra (DA)
WD1057+719 Figure 5
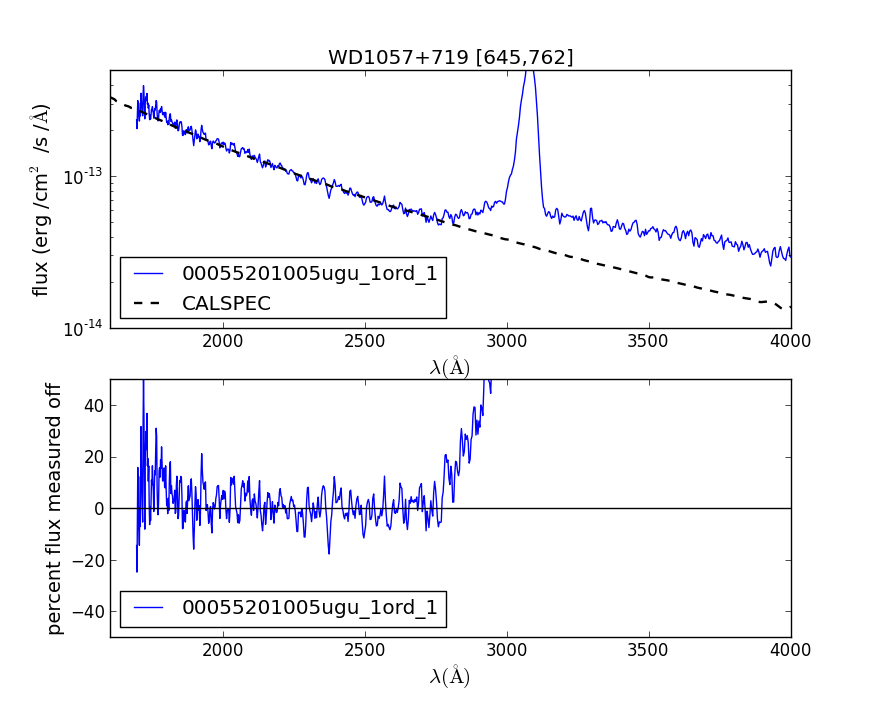
This spectrum with anchor at [645,762]. Al zeroth order is present contaminating the 3100A region.
WD1057+719 Figure 6
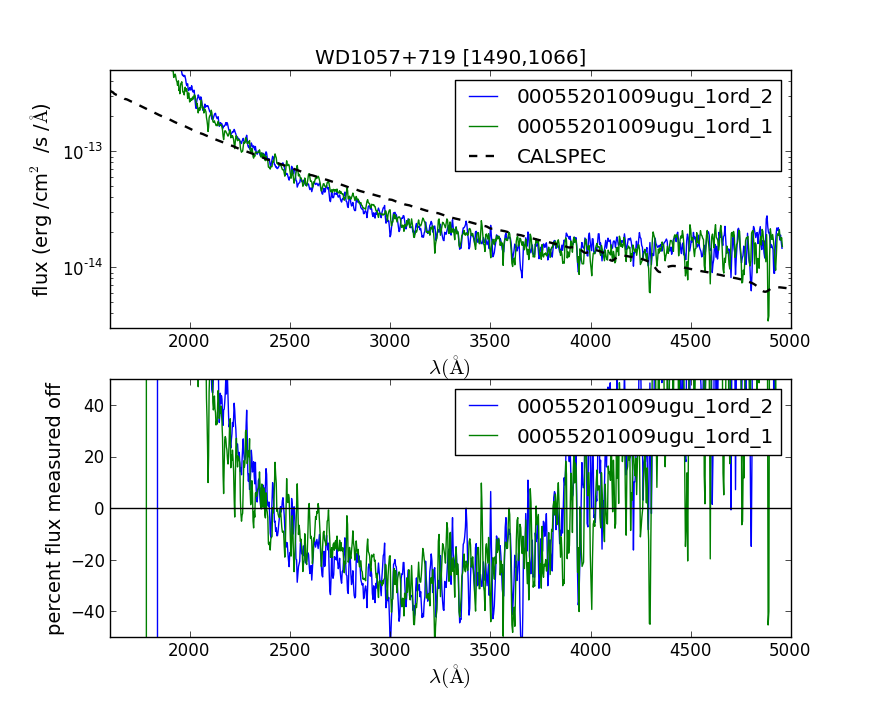
This spectrum with anchor at [1490,1066].
WD1057+719 Figure 7
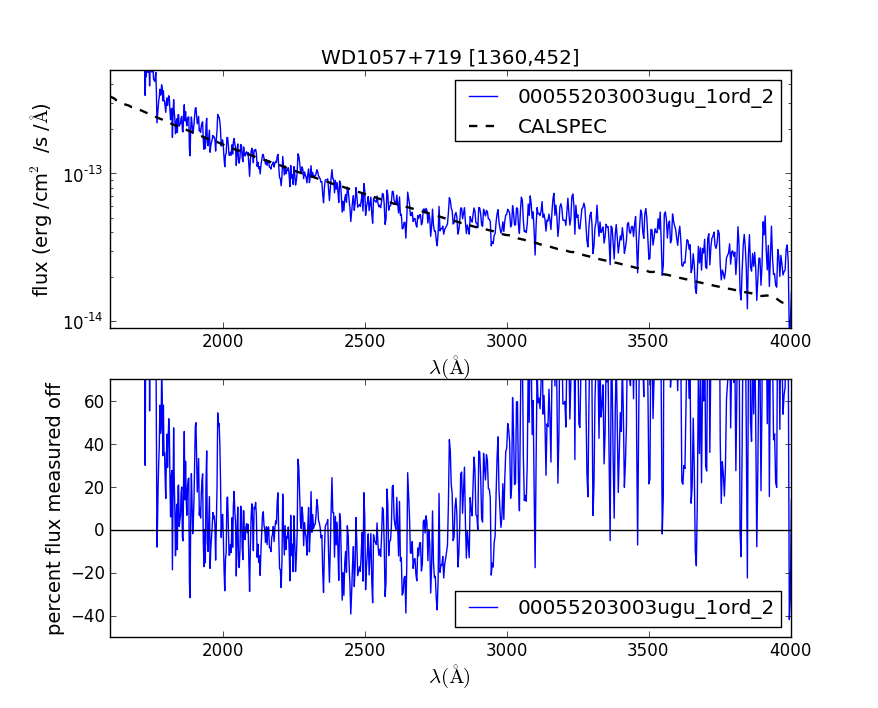
This spectrum with anchor at [1360,462].