
Swift UVOT UV-grism wavelength accuracy in the nominal mode
A Statistical overview of the wavelength calibration accuracy
The errors in the wavelength calibration are summarised in the figures on this page, while details for the individual calibration observations are on subsequent pages. The error analysis is based on grism plus lenticular filter observations. If further updates were made they are mentioned at the bottom of this page.
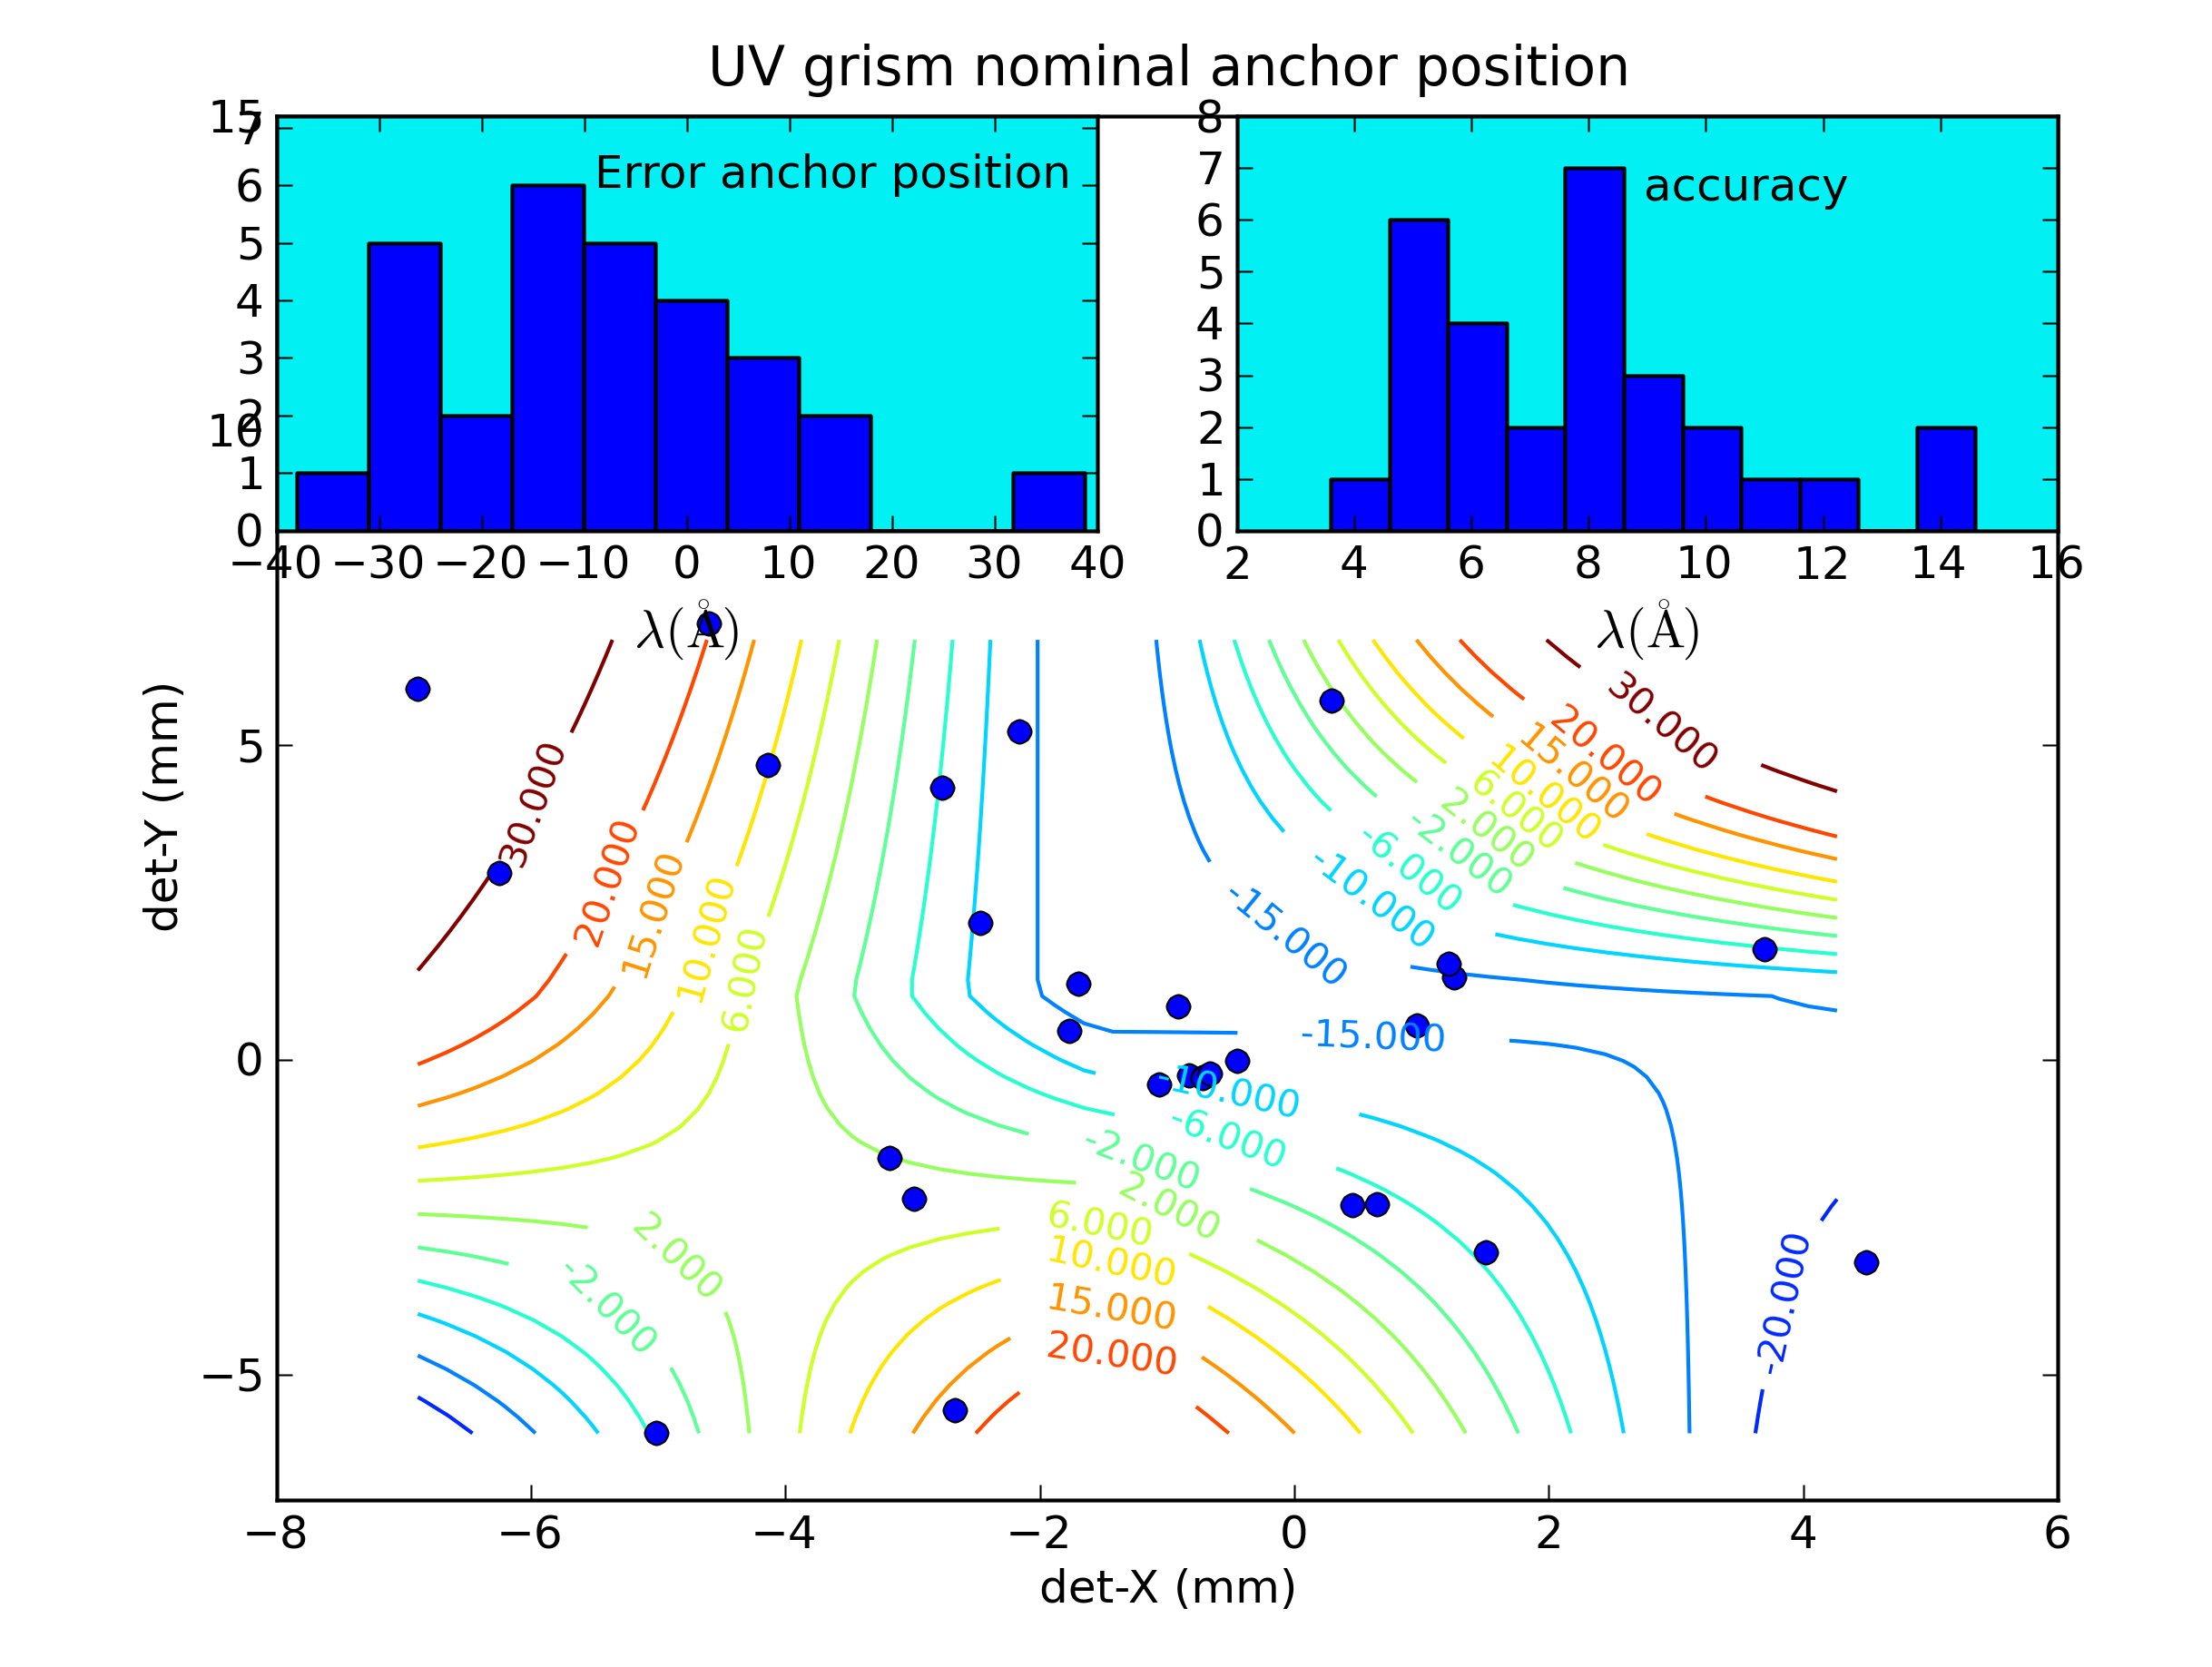
Figure 1: The wavelength scale errors have been split in two parts. The first is the offset of the whole scale due to errors in the anchor position and is shown as a histogram in the inset top left. The second is due to errors in the dispersion and is shown as a histogram in the top right. The data are based on the calibration spectra taken at locations all over the detector. The locations are shown in the main graphs by their anchor positions as blue dots. The error in anchor position is smallest near the default location for placing targets and largest near the edges and are shown as contours labeled with the offsets in Å.
The inset in the top left corner shows that at most times the anchor point that was predicted using the lenticular filters taken just before and after the observation, for the first version of this calibration has a mean offset of -8.0 Å averaged over the calibration observations. One outlier shows that occasionally an even larger offset occurs. Ignoring this offset, the anchor is found to cause an error which can be as large as 33Å.
The contours give a better picture of where the calibration for the anchor position results in an offset in the wavelengths. In the corners and near the edges, only a few observations were available for the calibration, so the values should be taken as an indication of the size of the error, rather than an accurate value that can be used to improve the wavelength scale knowledge.
Looking at the second inset “accuracy”, and disregarding the systematic wavelength scale offset from the top left inset, wavelengths from the dispersion relation are found to typically fall within 14 Å (about 4 pixels) of the correct value. The “accuracy” is the RMS dispersion of the dispersion errors over the whole range as shown in the accuracy plots in more detail, and not the error themselves.
The variation of the accuracy of the dispersion relation over the detector can be seen from the contour plot below. The contours are the RMS values of the wavelength errors of known lines in the calibration spectra. There is only a small variation over the face of the detector present, with the largest discrepancies in the top left and bottom right corners. This can possibly be improved by applying a bilinear correction as a function of the detector position to the Zemax model dispersion constants. In the UV nominal grism, a constant was used. In the other grism modes which were done later, a bilinear correction was used. The overall accuracy is generally sufficient to avoid making misidentifications of the larger spectral features which have a FWHM which is comparable in magnitude, although wavelength scale errors of up to 40 Å were seen for the calibration.
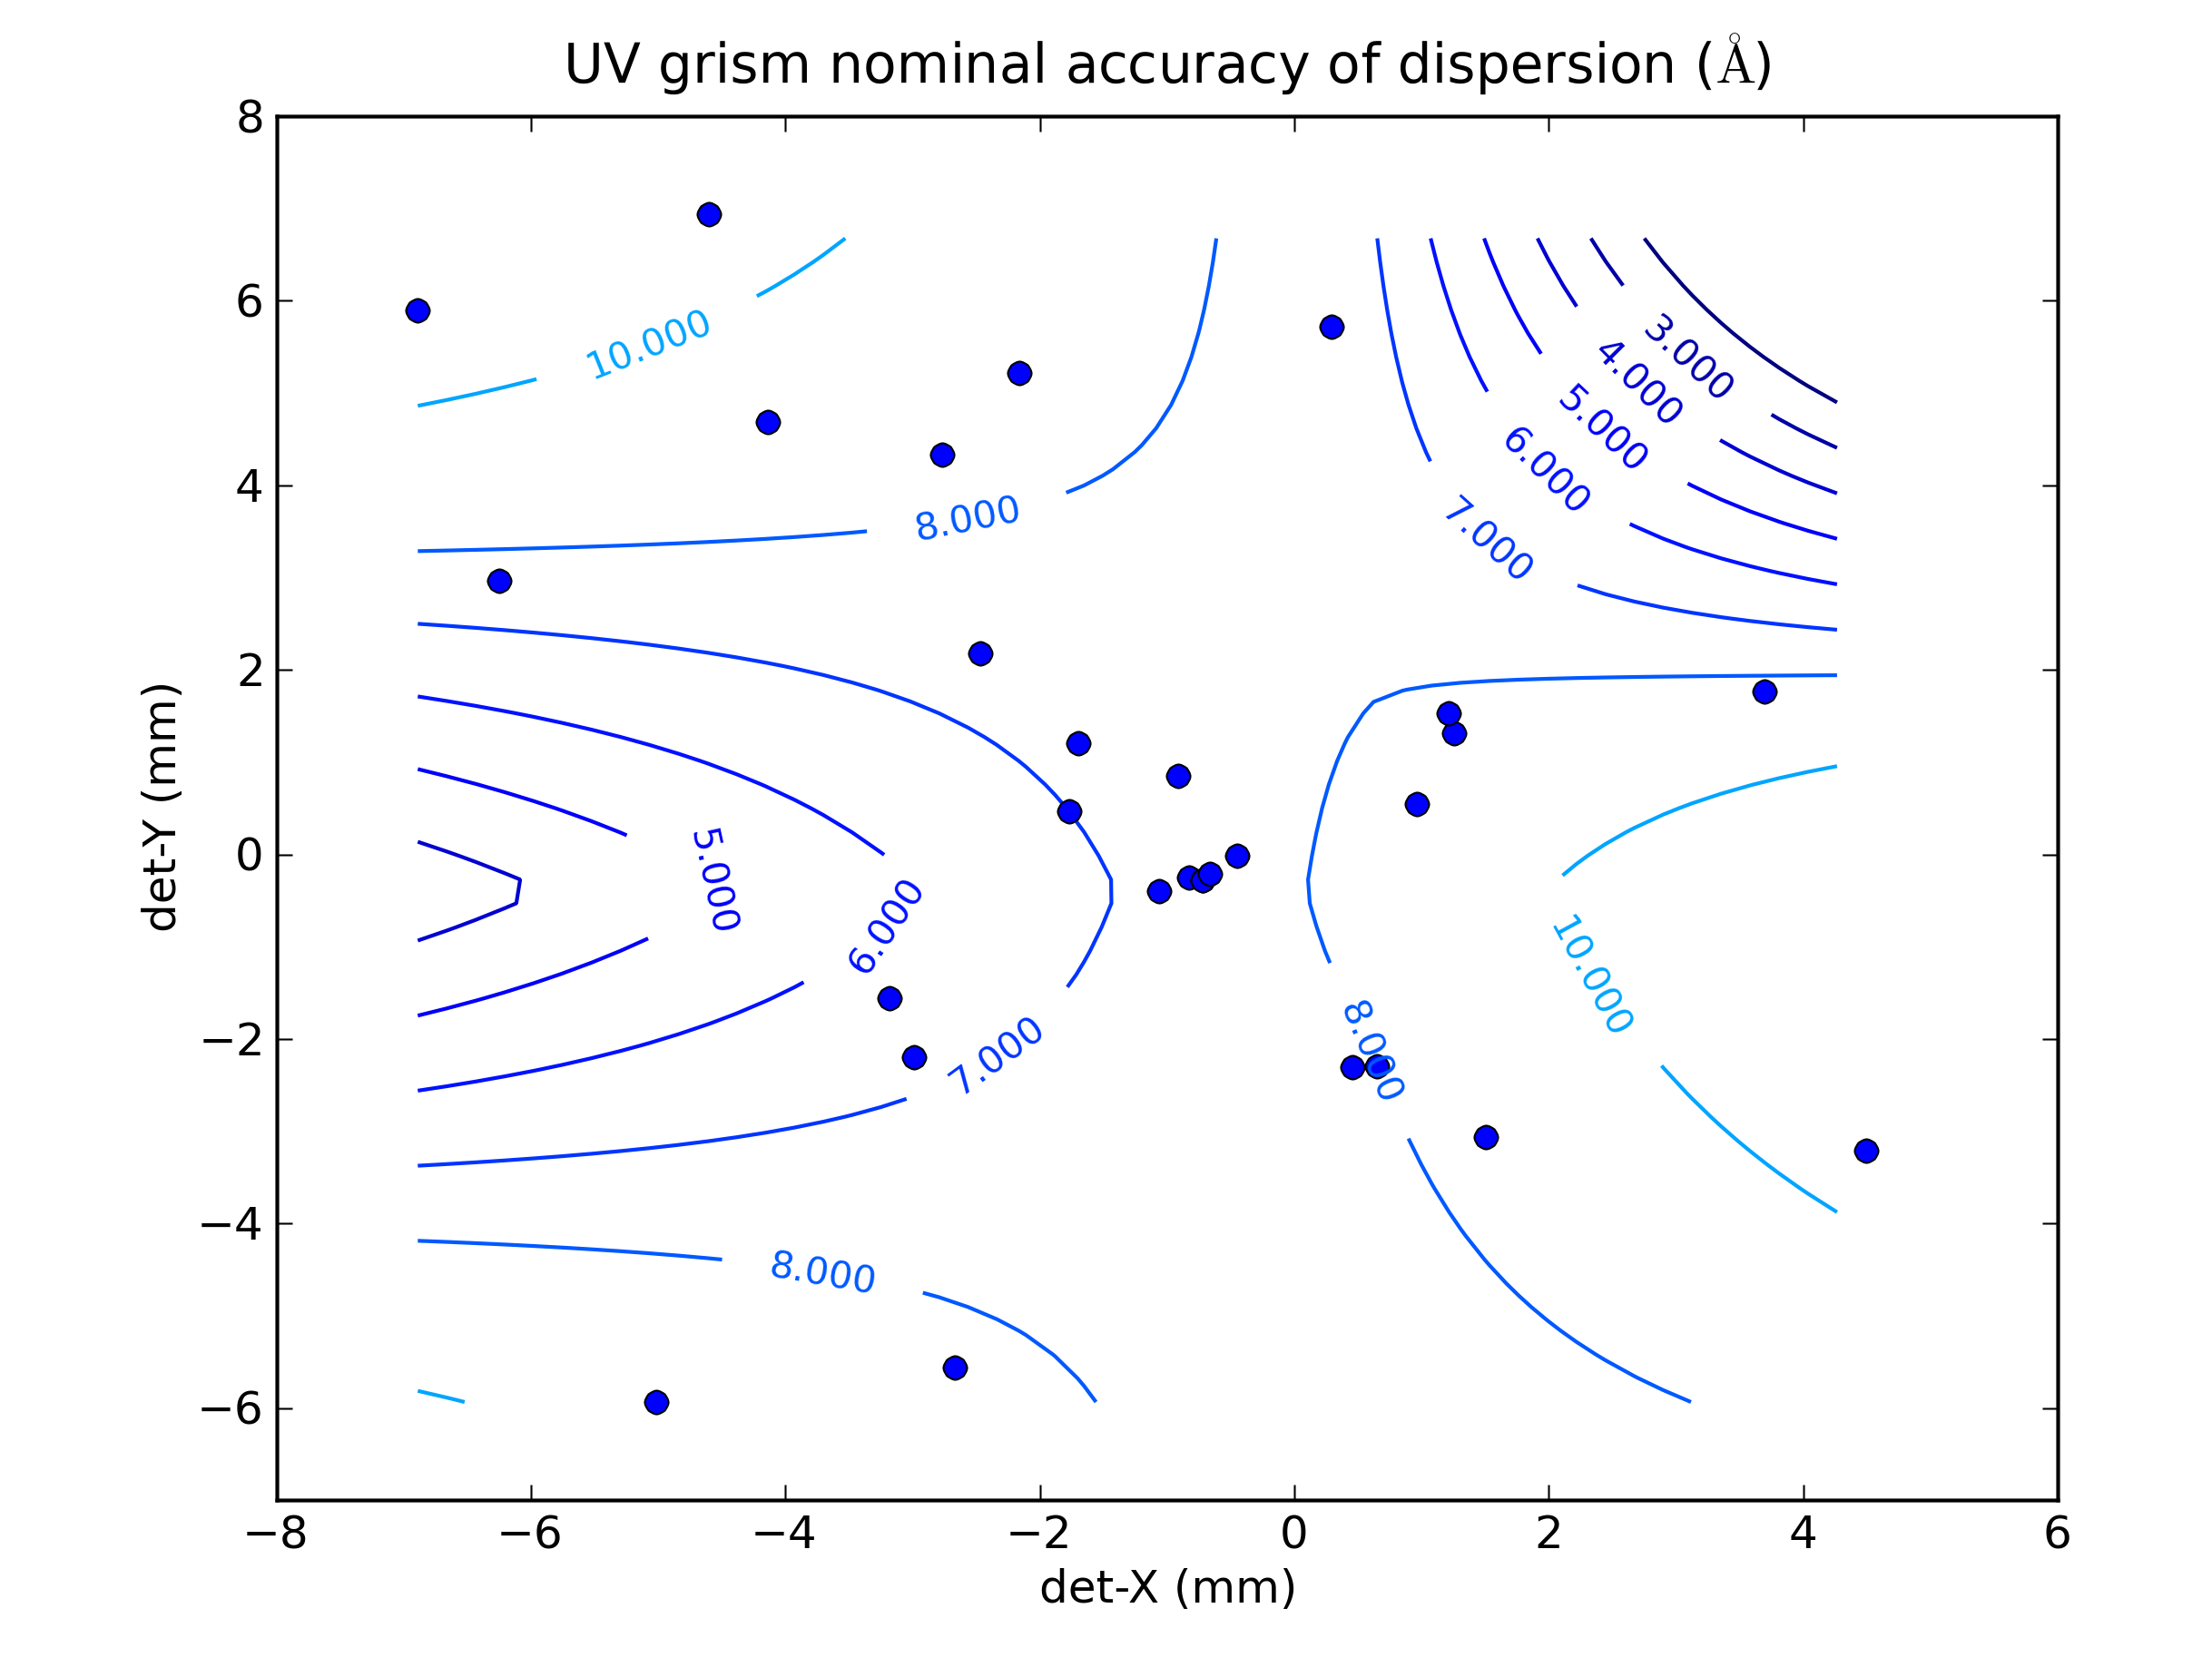
Figure 2: contour map showing the variation over the detector of the RMS error due to dispersion. Positions were based on the anchor position of each calibration spectrum.
Detailed plots of the wavelength accuracy and of the spectra used
In order to allow better understanding of the capabilities, the data obtained by verification of the calibration spectra with the calibration are provided, as well as plots of the accuracy of fit for the individual observations. See the detailed spectra and accuracy plots.
Updates to the calibration
A small correction was made to the anchor positions prior to the release of the wavelength calibration file to compensate for the mean shift seen in the histogram of the anchor position offsets.
Technical Documents
- Swift UVOT Calibration report. Zemax optical models for the UV-Grism study: Zemax pixel scale factor and positioning. MSSL 2008.
- Swift UVOT calibration report: Zemax optical models for the uv grism study. Second order wavelength scale for sources near the axis.