NOTE: The following describes the accuracy of anchor and wavelength for
observations of the Grism+lenticular filter combination only.
The accuracy and spectra of the 2009 wavelength calibration
A more detailed explanation is given in the nominal mode page. For each spectrum line positions were measured and compared to the predicted positions using the calibration file and uvotpy program.
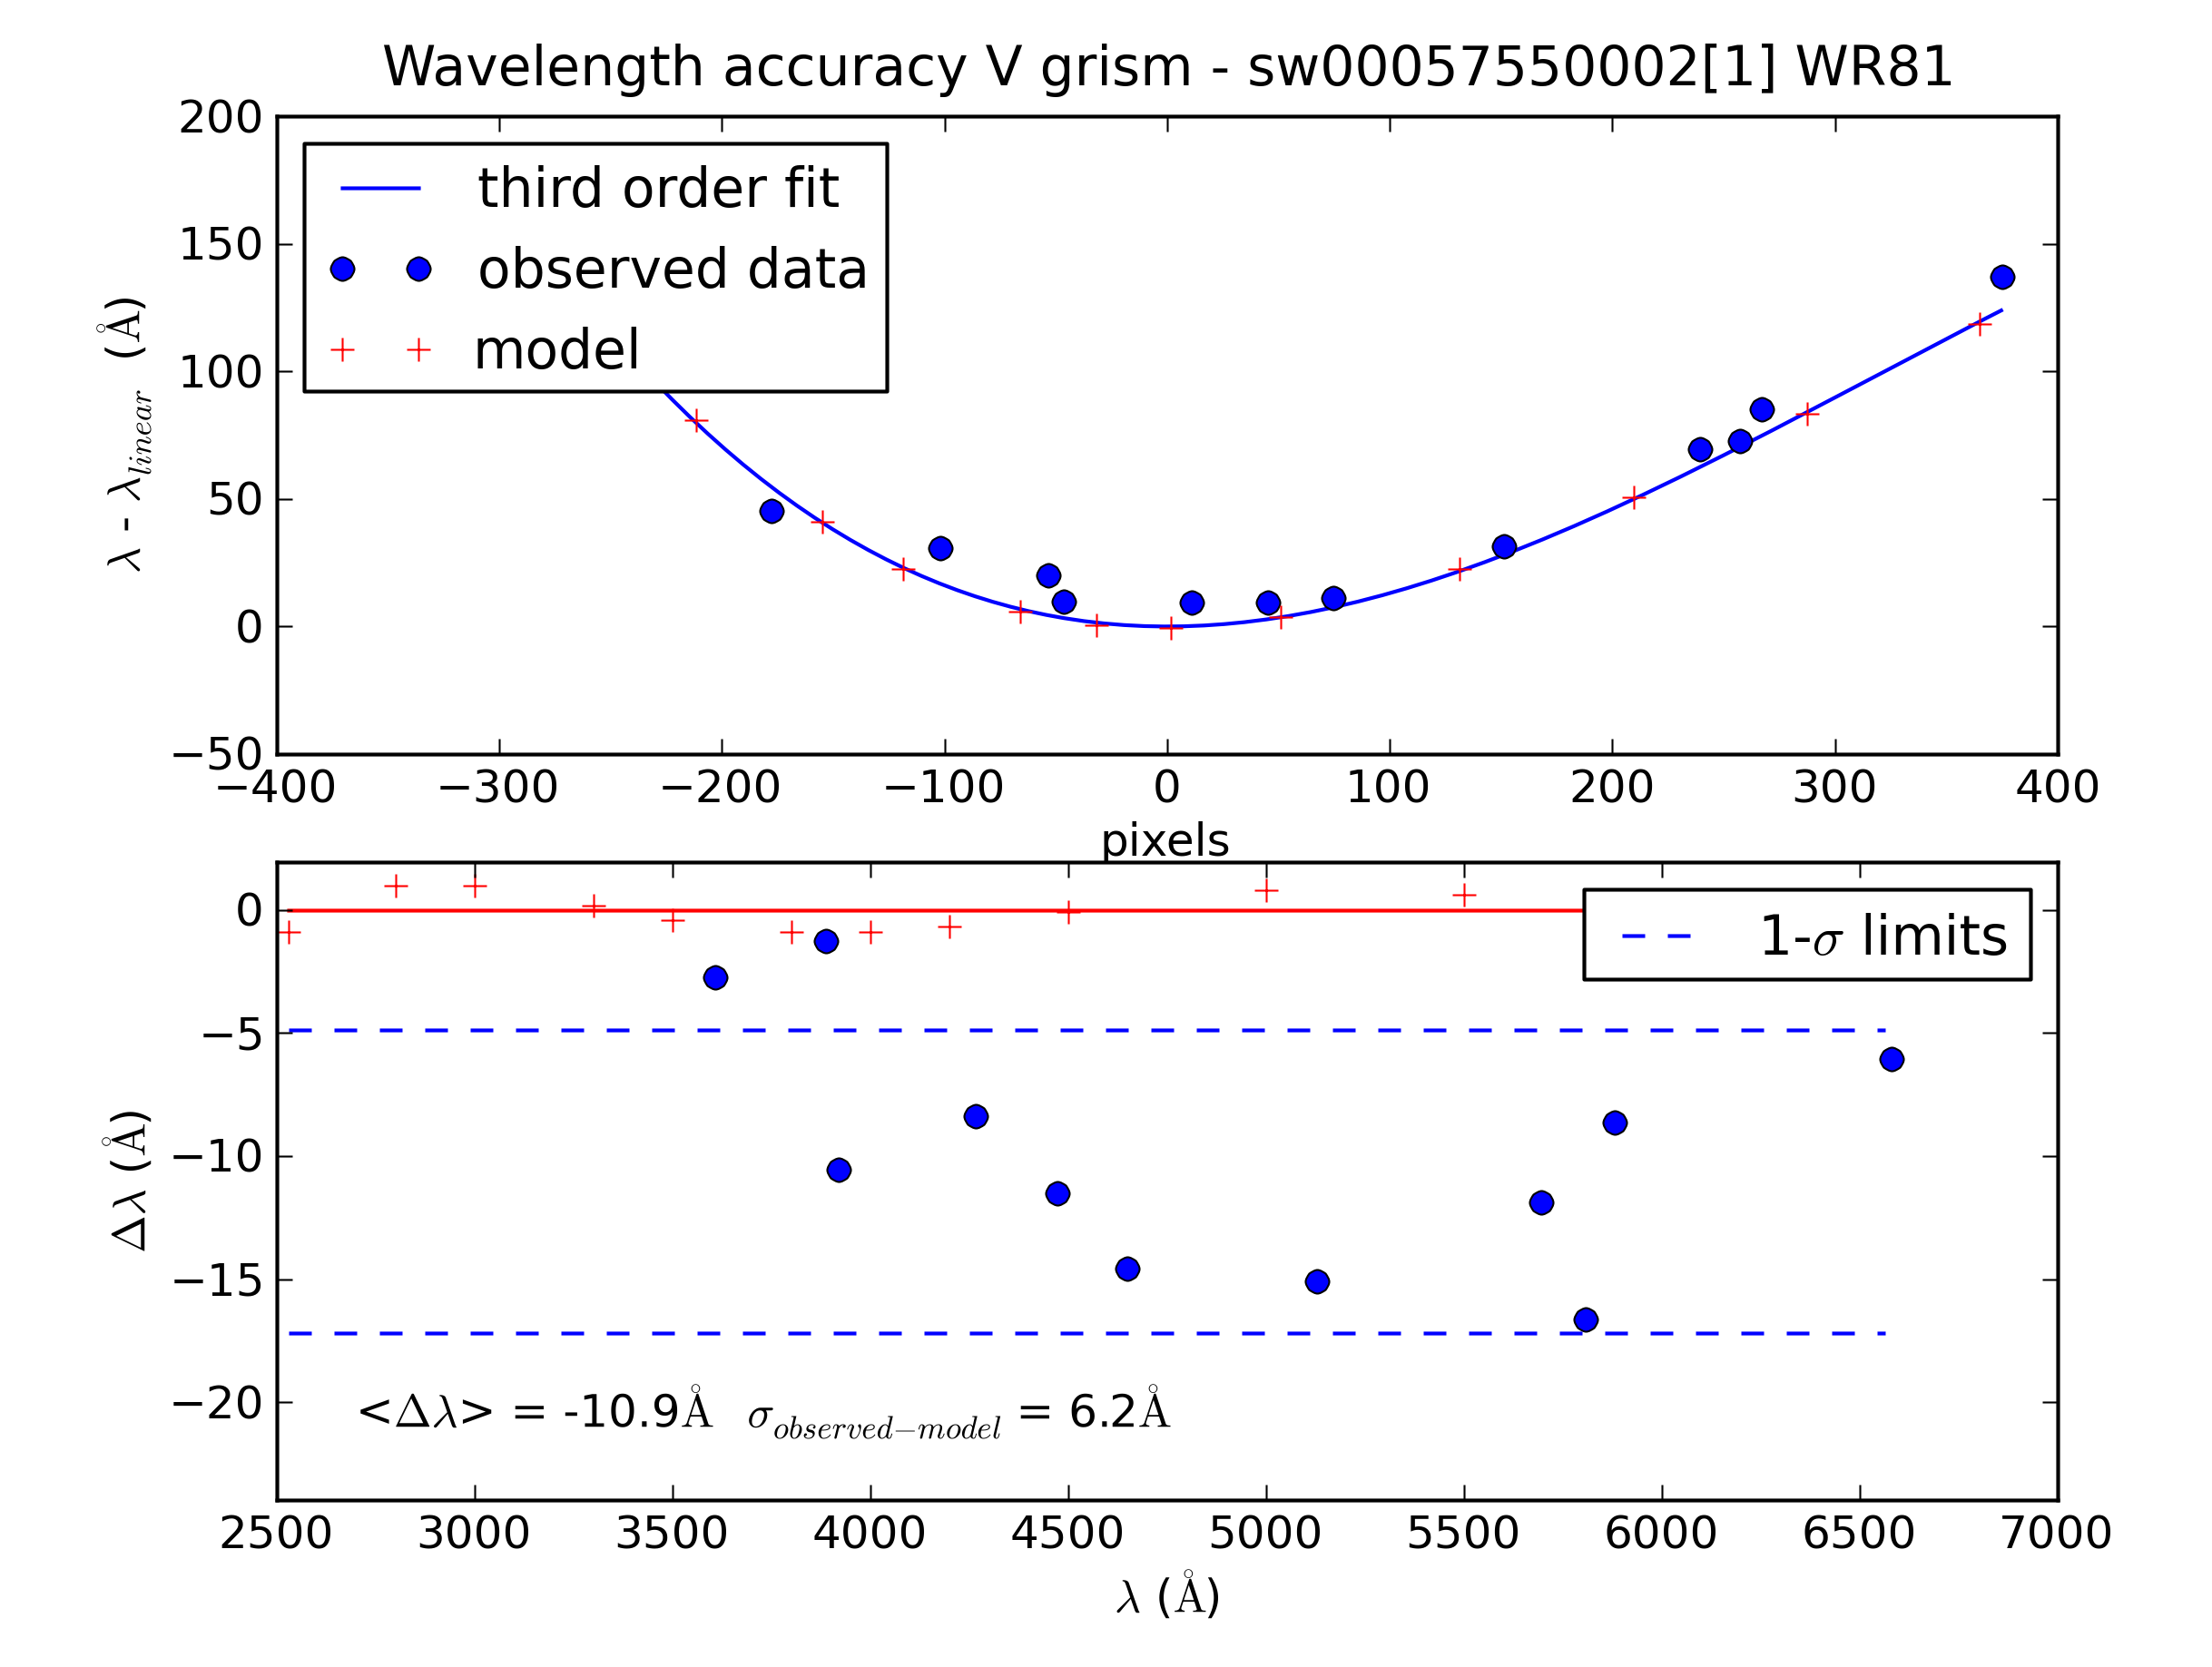
How to read the wavelength accuracy plots
Wavelength accuracy plots were made for each useful calibration spectrum. The format of the accuracy plots is to have two panels. Since the main variation of the dispersion can be represented by a constant with a linear term, the top panel of the accuracy plot has taken those two terms out. The higher order terms tend to zero near the adopted anchor point, which for the V-clocked grism mode is ~4200 Å. The dispersion from the scaled optical model has been approximated with a polynomial. The observed line positions from lines identified in the calibration spectrum have been plotted as blue dots. The lower panel of these wavelength accuracy plots shows the remainder after subtraction of the predicted position. The observed position was found from the pixel distance to the anchor point and the dispersion relation, while the predicted position was found using the known wavelength.
The difference can be divided into an offset due to errors in the anchor position
and a random looking spread around that offset indicative of the accuracy of the
line positions. The values for those are given in the plot.
In some points near the edges of the
detector, the scaled model dispersion deviates and the points will not
evenly be distributed around some mean offset.
The upper left corner (low det-X, high det-Y) has no first orders
because of the aperture effect from rotating the filterwheel further
so that part of the light is blocked.
A clickable map for selecting wavelength accuracy plots by position
The map below provides links to the wavelength accuracy plots.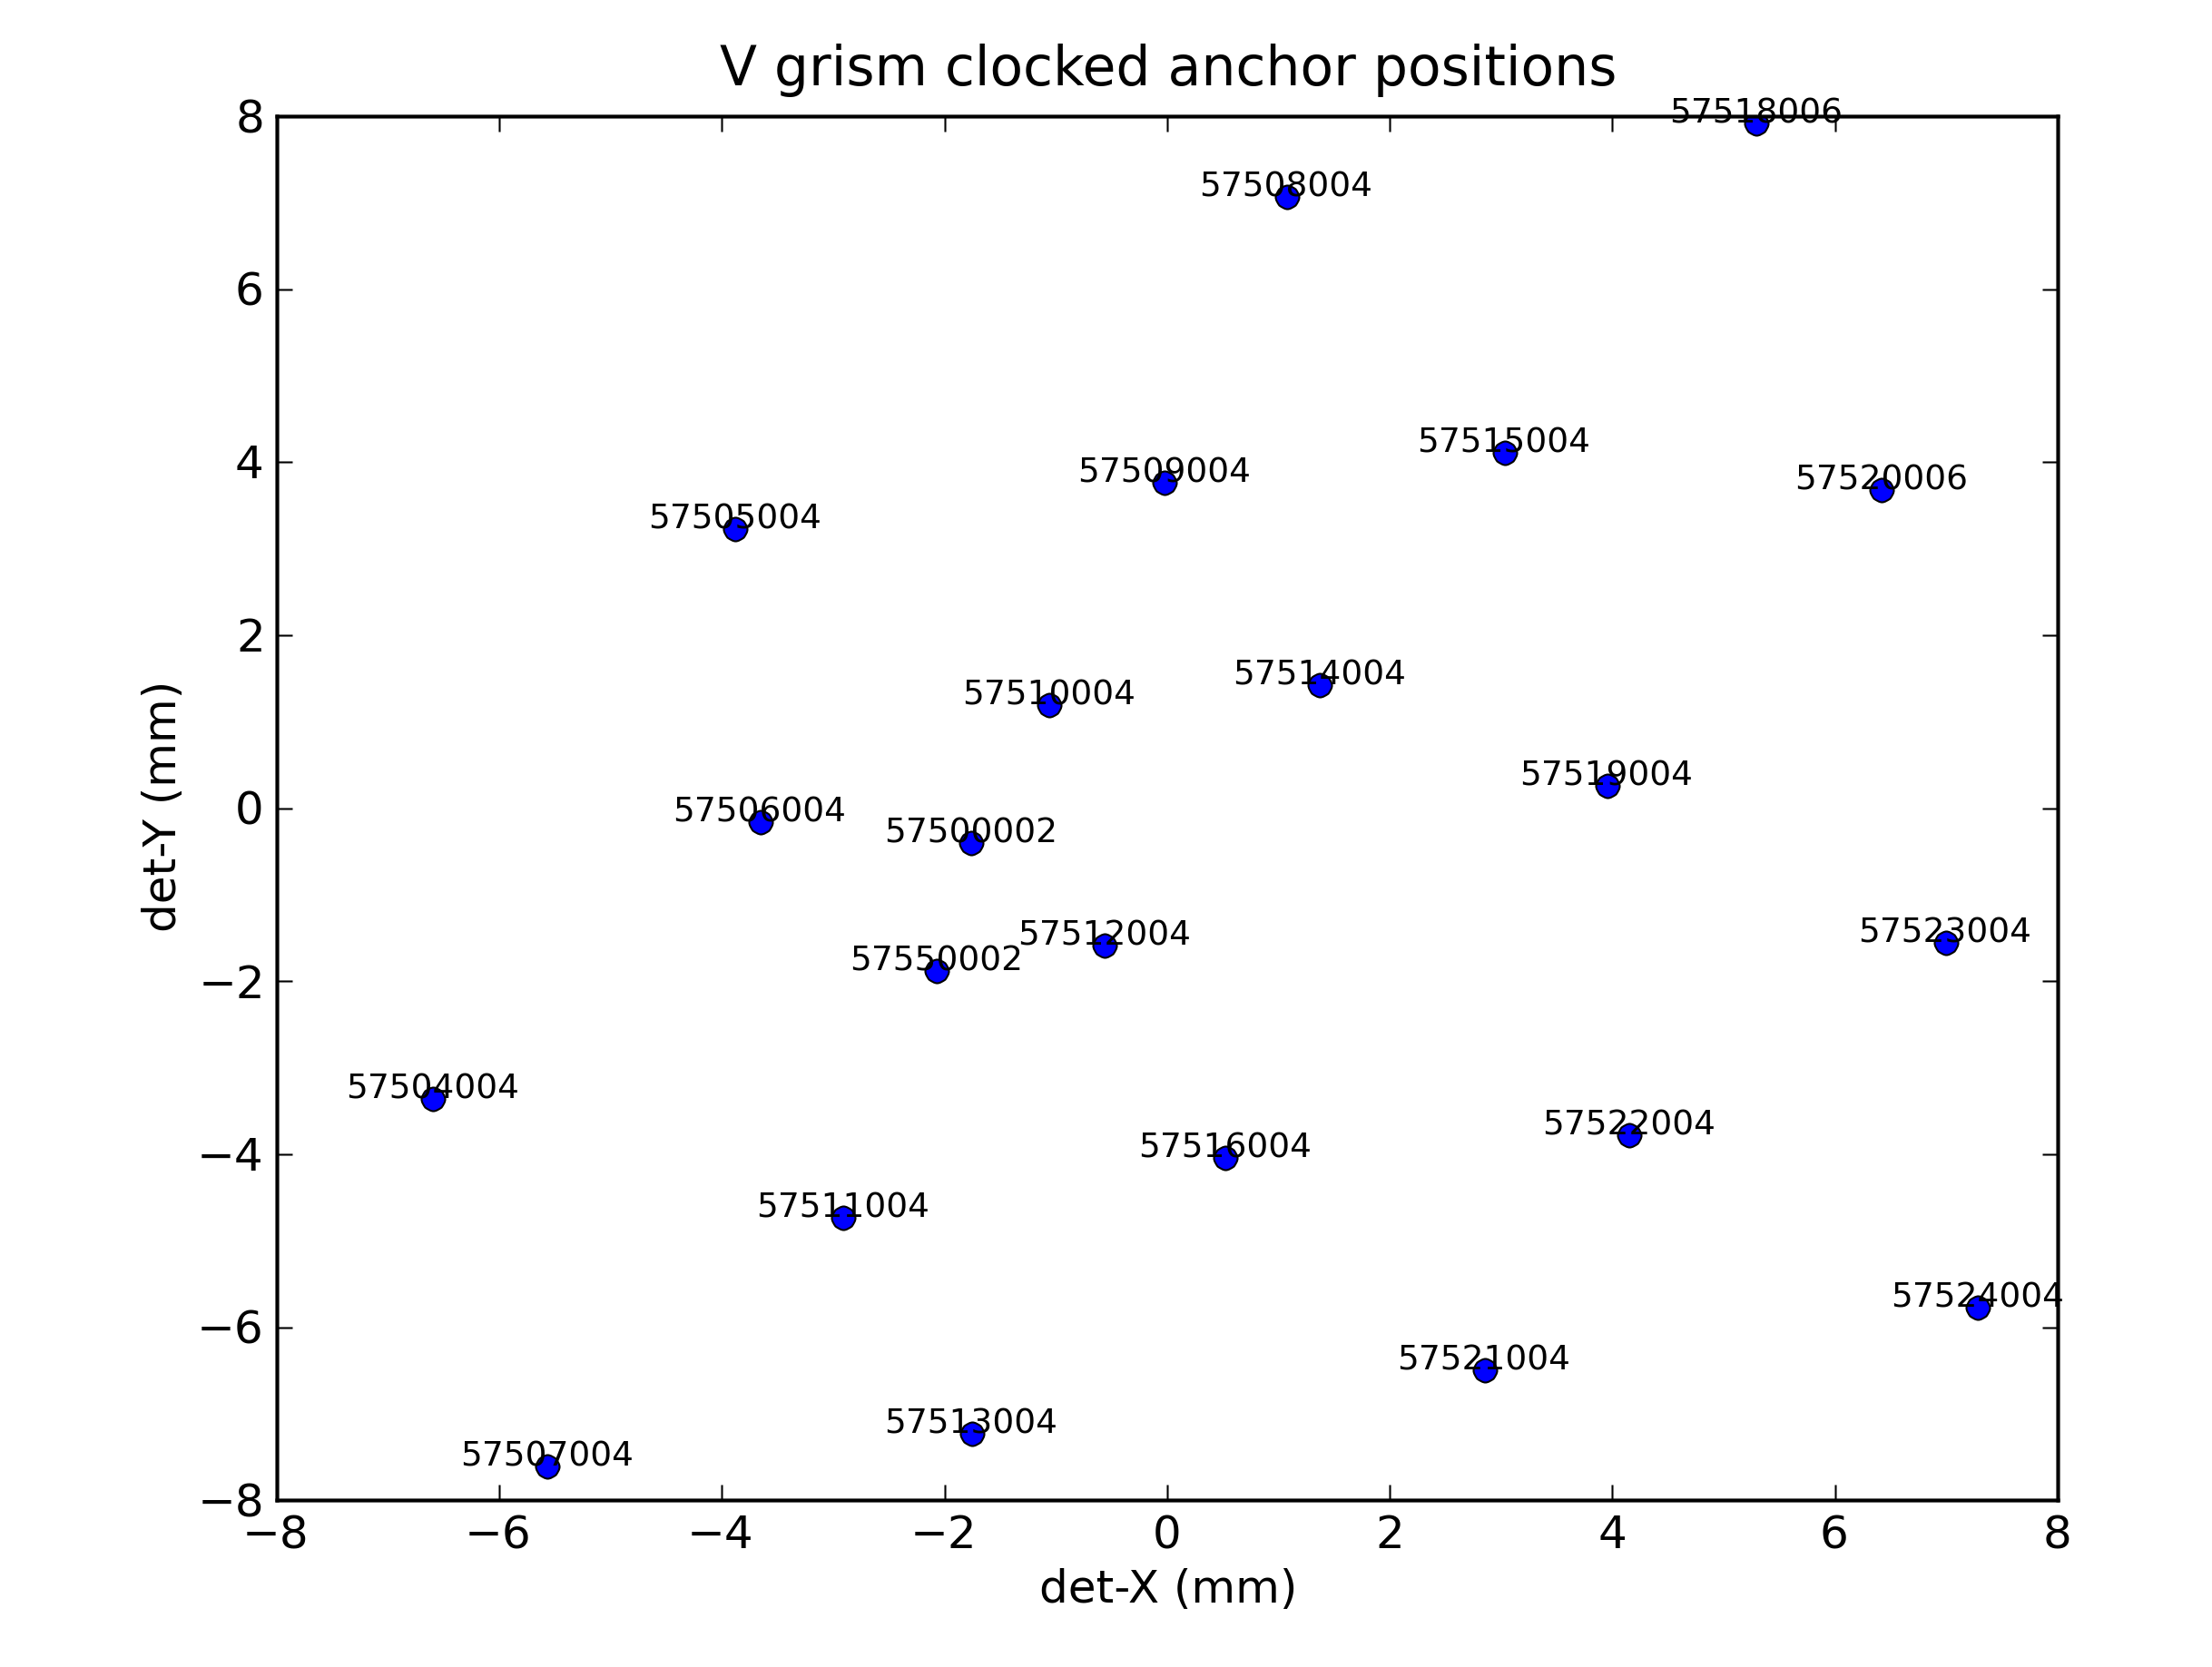
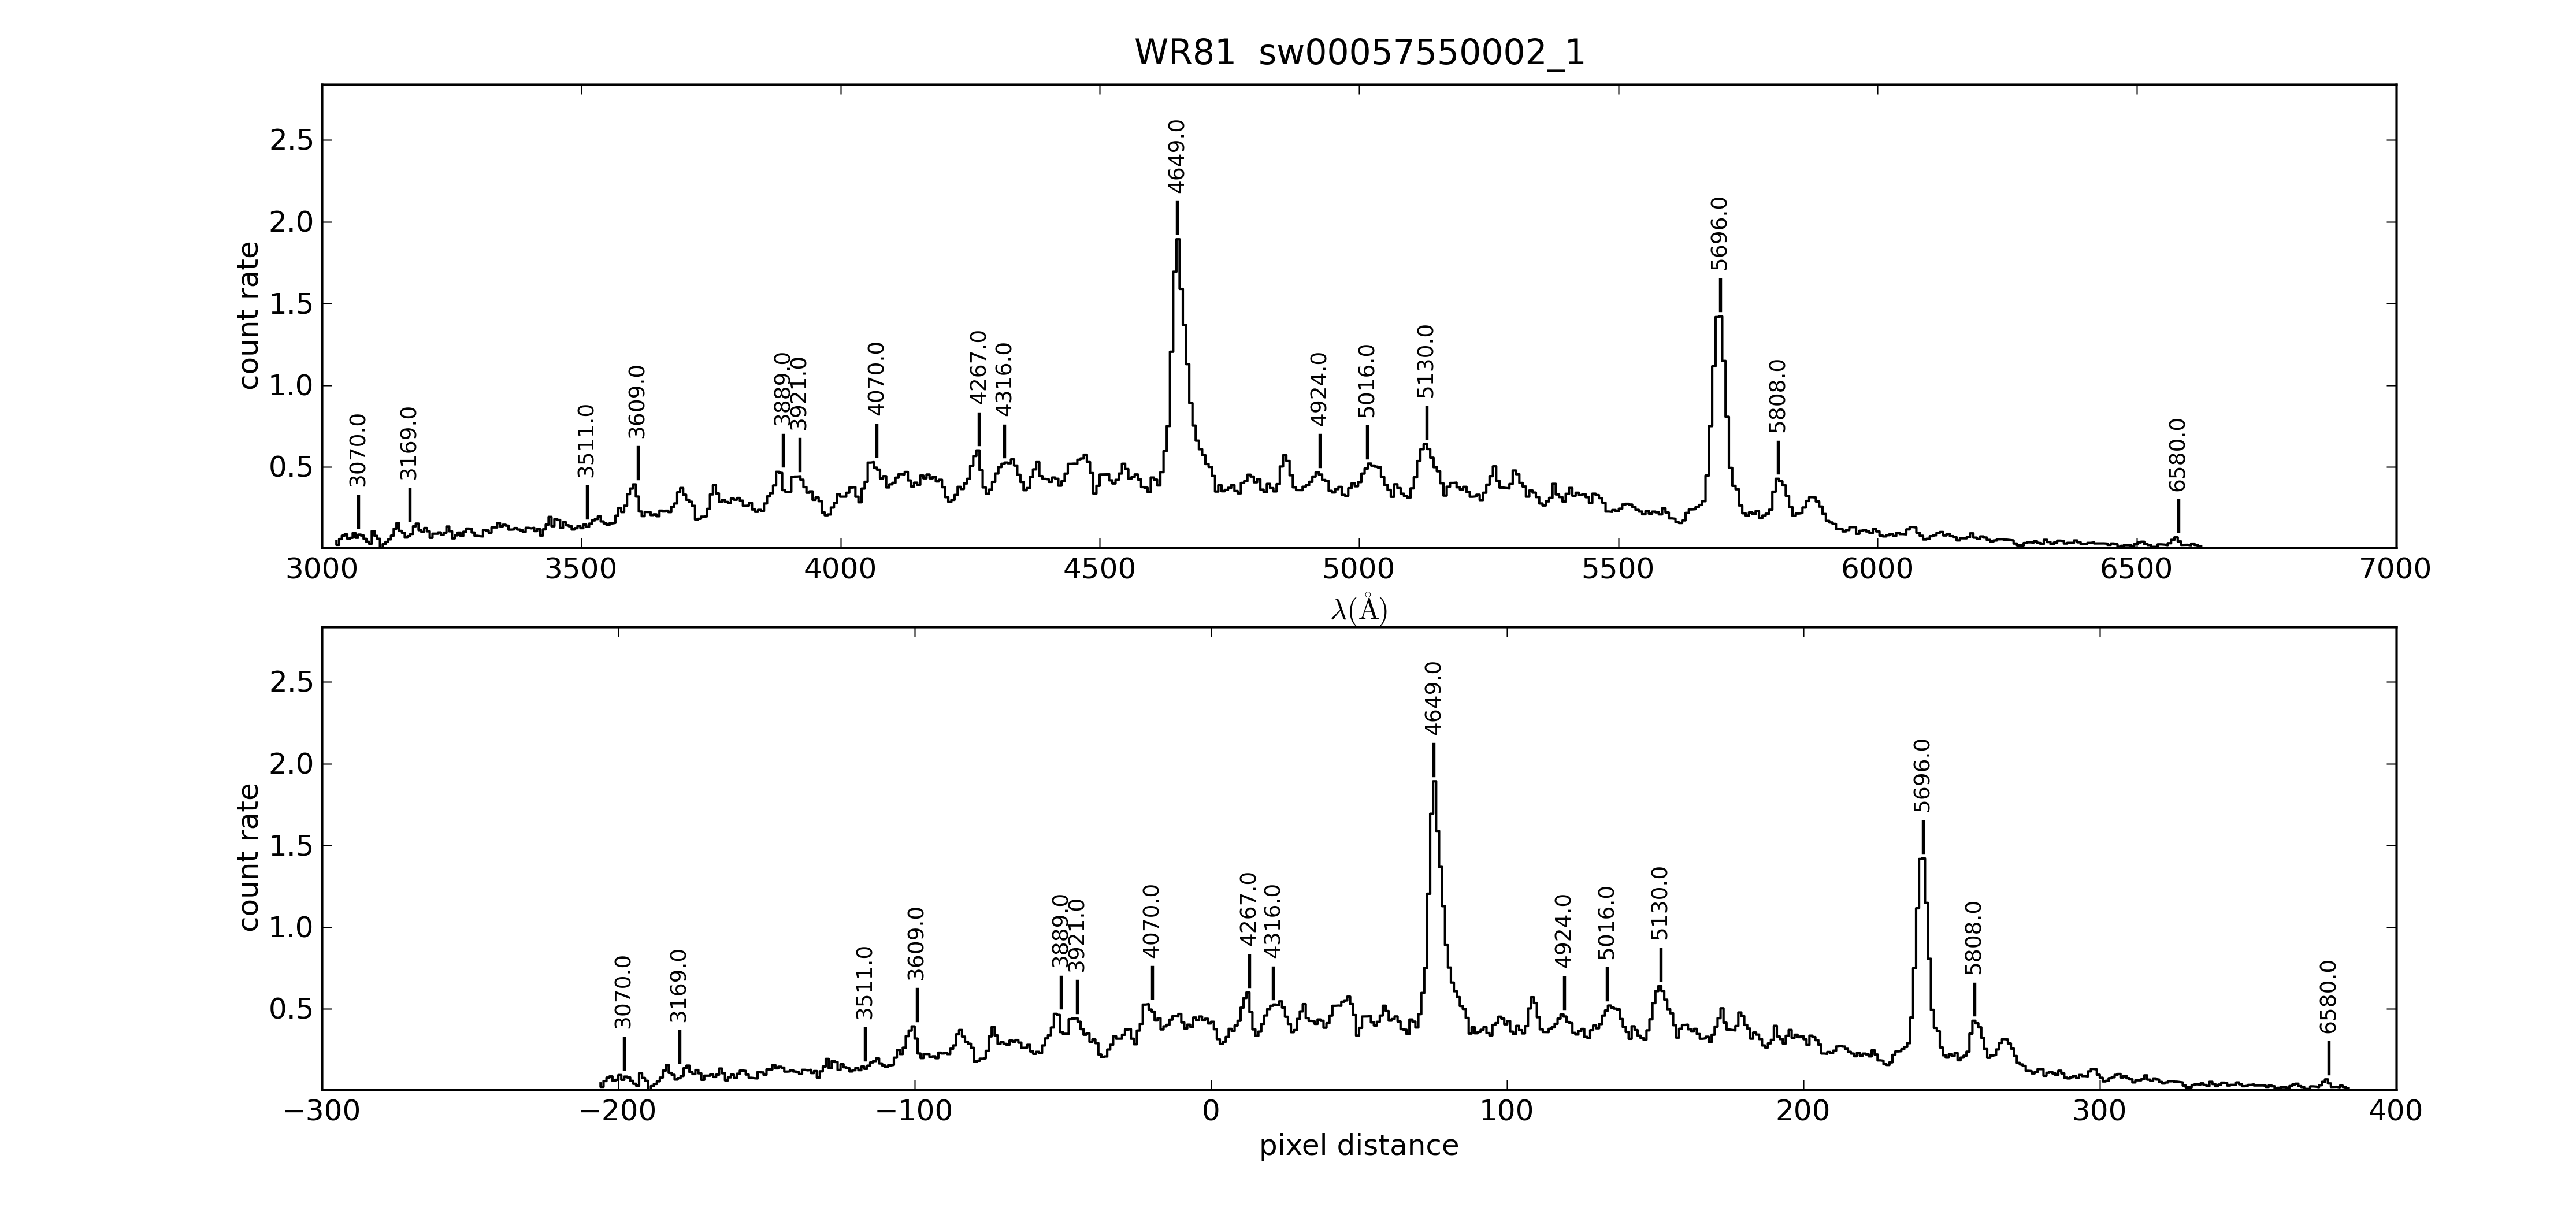
A clickable map for selecting count rate spectra by position
Here the count rate calibration spectra can be found. The top panel as a function of fitted wavelength, the bottom panel as function of pixel coordinate. The stronger lines have been identified. Any shifts between the predicted line position and the actual spectrum can be seen in the top panel as an offset.
The count rate in the spectra can be seen to vary across the detector, which is partly due to variations in sensitivity, and perhaps also to variablility in the source, which was chosen for calibrating the wavelengths using the many spectral lines.
The calibration file used was swwavcal20100421_v0_mssl_vc955_wlshift-8.0.fits. In some browsers the maps do not work. In that case the plots/images can be found here.
