Slew settling performance
The data used were up to 2006-01-31 and extracted from the sequential print logs on msslje.
PT slews (generally longer)
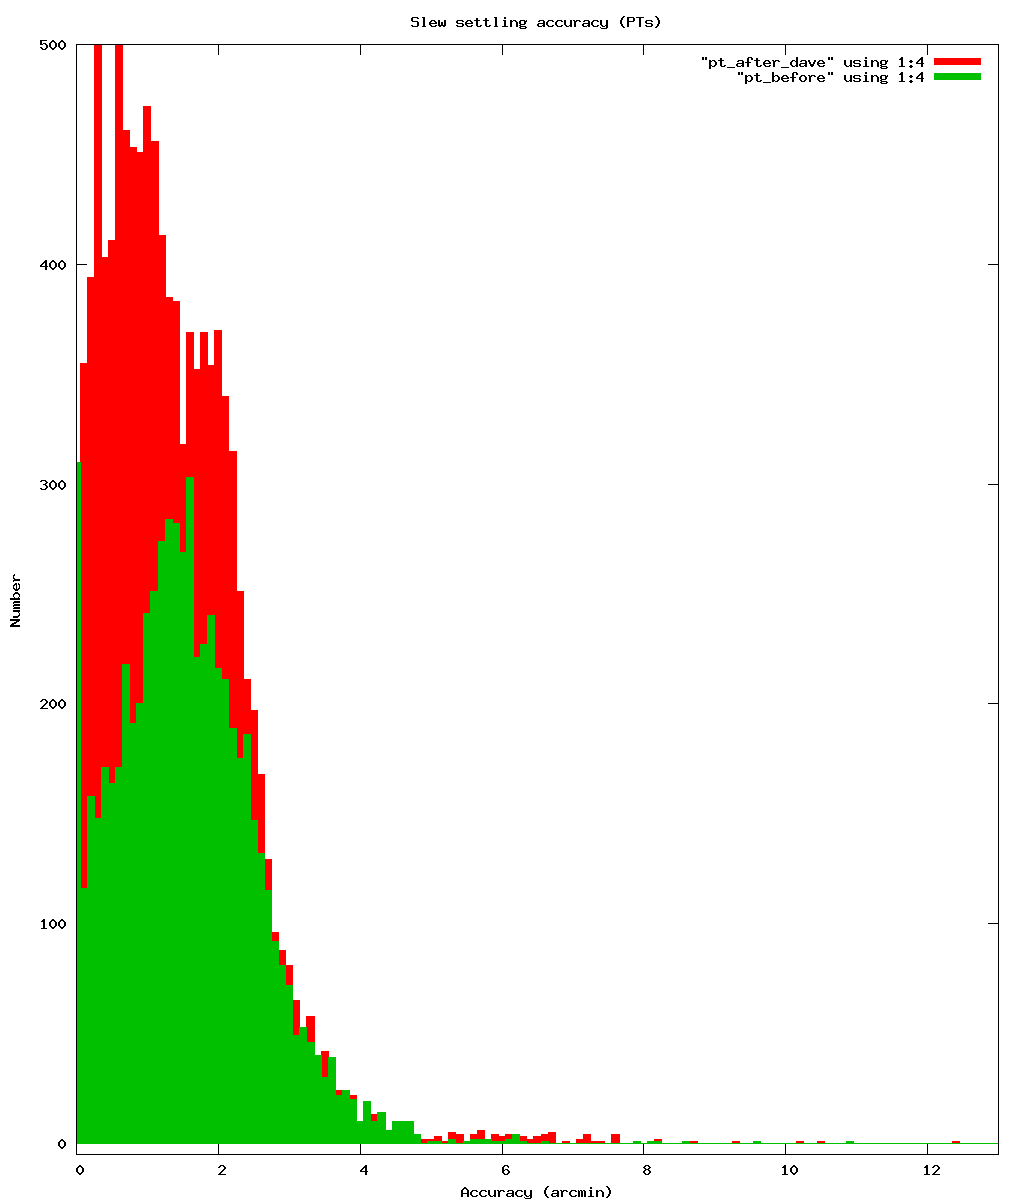
This graph shows the slews before the DAVEDELAY change in RED and the slews after the DAVEDELAY change in GREEN.
The x-axis is the difference in the actual position from the target position. The y-axis is a count for that bin.
The graph is a histogram of settling accuracy in 1 acrmin bins.
There is a noticeable improvement in settling accuracy after the DAVEDELAY change.
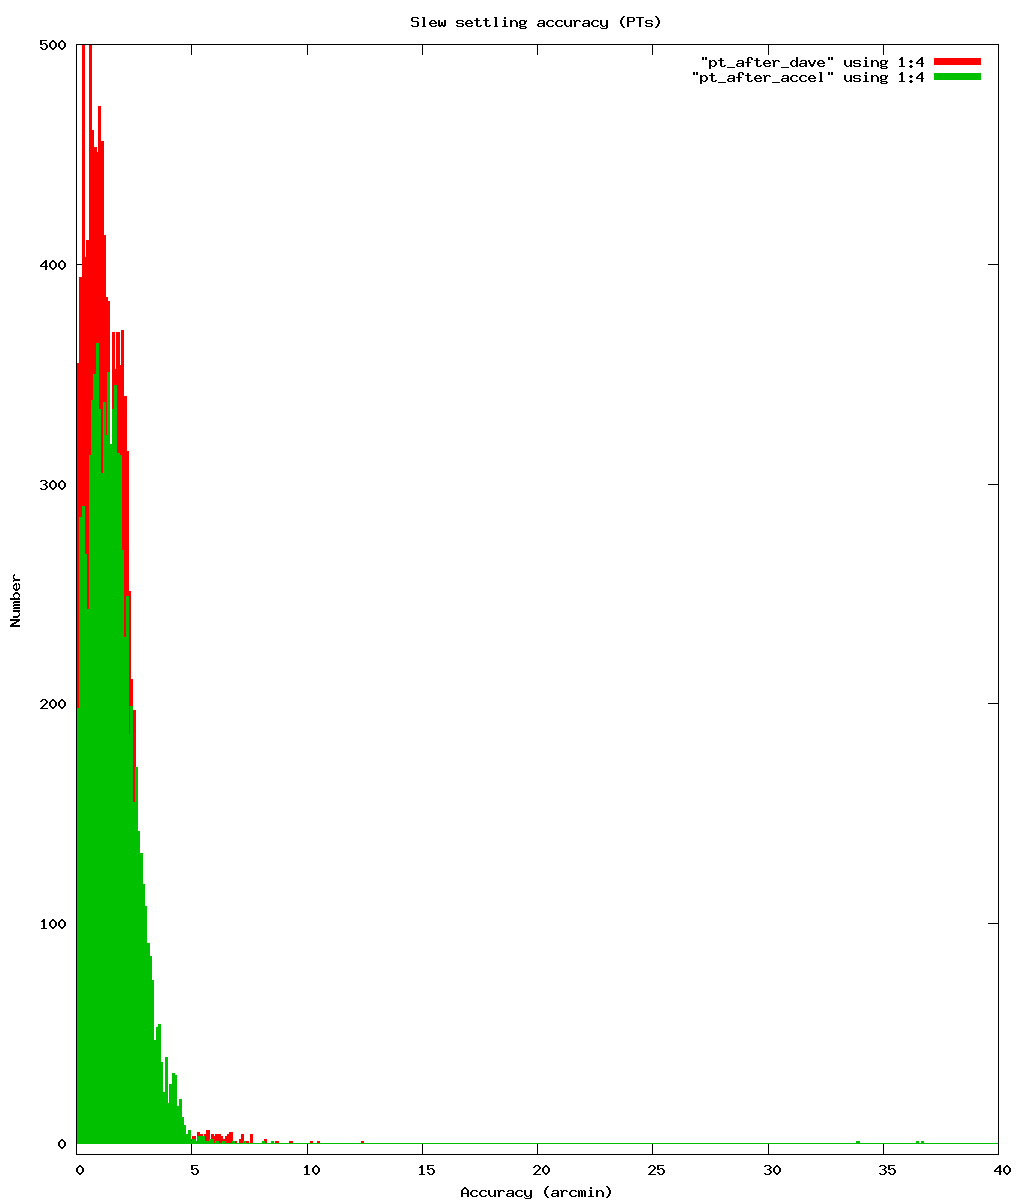
This graph shows the slews between the DAVEDELAY and ACCEL changes in RED and the slews after the ACCEL change in GREEN.
The x-axis is the difference in the actual position from the target position. The y-axis is a count for that bin.
The graph is a histogram of settling accuracy in 1 acrmin bins.
First time AT slews (generally shorter)
First slews to a GRB are short as they must be inside the the 50 degree BAT field of view.
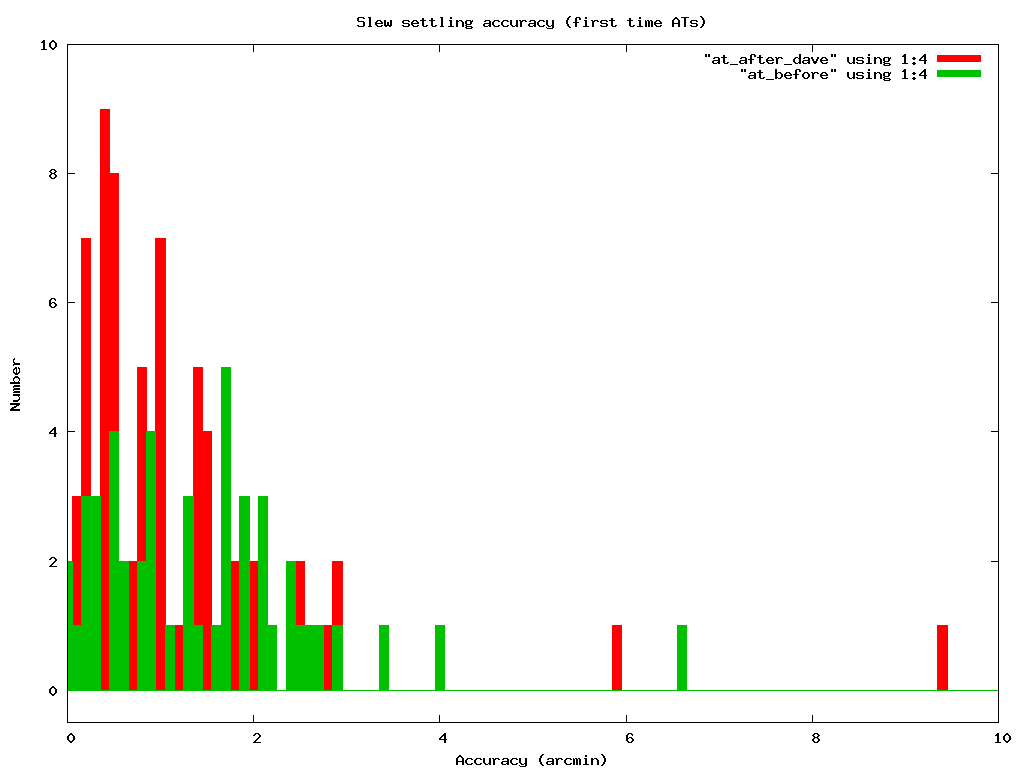
This graph shows the slews between the DAVEDELAY and ACCEL changes in RED and the slews after the DAVEDELAY change in GREEN.
The x-axis is the difference in the actual position from the target position. The y-axis is a count for that bin.
The graph is a histogram of settling accuracy in 1 acrmin bins.
There is not much of a visible improvement in settling accuracy after the DAVEDELAY change but the statistics are low.
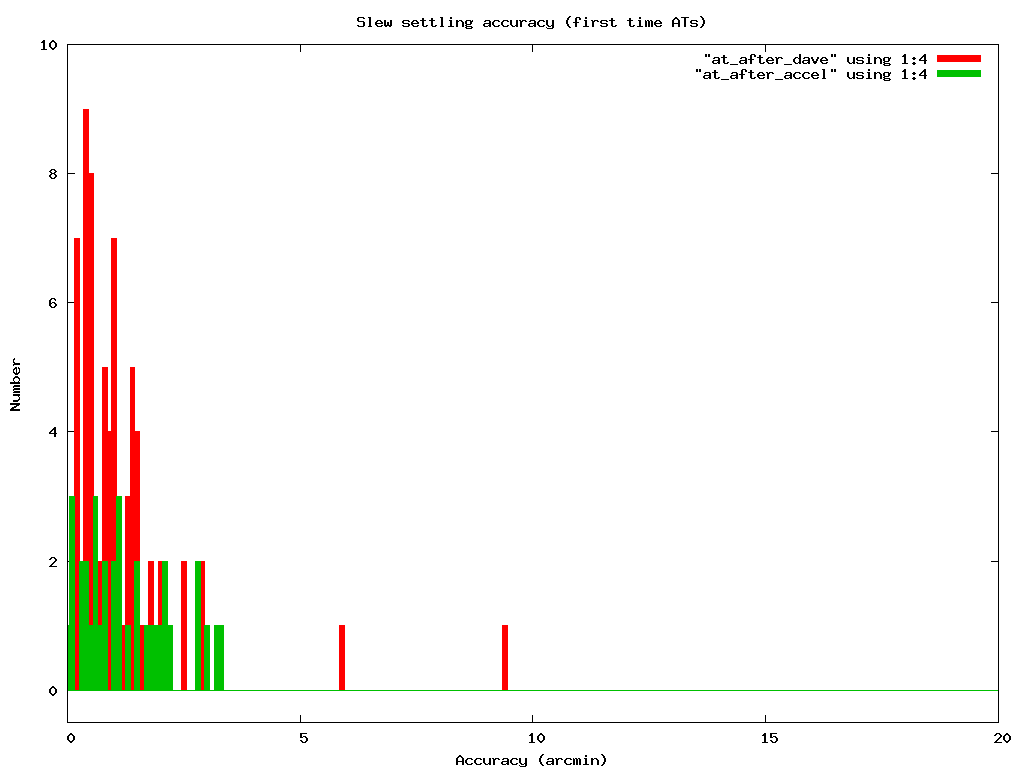
This graph shows the slews before the ACCEL change in RED and the slews after the ACCEL change in GREEN.
The x-axis is the difference in the actual position from the target position. The y-axis is a count for that bin.
The graph is a histogram of settling accuracy in 1 acrmin bins.
Statistics
After the DAVEDELAY change ...
- 94.74% of the PT slews have settled within 3 arcmin of the target
- 99.81% of the PT slews have settled within 7 arcmin (UVOT requires) of the target
- 97% of the first time AT slews (all but two) have settled within 3 arcmin of the target
- 99% of the first time AT slews (all but one) have settled within 7 arcmin (UVOT requires) of the target
After the ACCEL change ...
- 90.6% of the PT slews have settled within 3 arcmin of the target
- 99.9% of the PT slews (all but six) have settled within 7 arcmin (UVOT requires) of the target
- 91% of the first time AT slews (all but three) have settled within 3 arcmin of the target
- 100% of the first time AT slews have settled within 7 arcmin (UVOT requires) of the target