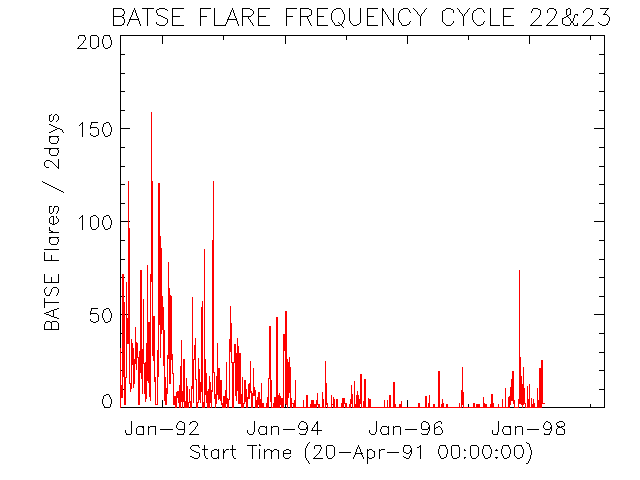
Figure 1. Number of solar flares detected with the BATSE LADs per day corrected for observing time for the period April, 1991 through February, 1998. Each bin covers 2 days.
Although BATSE is optimized for the detection of gamma-ray bursts, it is also the most sensitive instrument regularly available for the detection of hard X-ray solar flares. As such, it is of great value in providing high time resolution spectral observations over a broad energy range for up to 50% of all flares. Since the launch of the Compton GRO, we have maintained an interactive computer facility with the primary objective of making this unique solar flare data base readily accessible for scientific analysis by the international solar physics community.
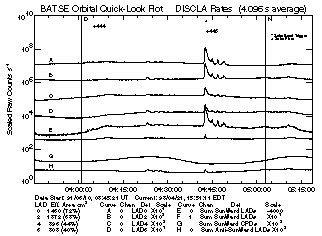
Our facility contains a continuously updated archive of all BATSE solar flare data since launch together with an extensive package of user-friendly, well-documented programs for data analysis. Internet access is available to the flare catalog and to the list of BATSE solar viewing time intervals. Plots of quick-look orbital data (Figure 1) and flare time profiles (Figure 2) can be obtained, and ASCII or binary data files can be downloaded for further analysis. Thus far, we have cataloged and archived nearly 5000 solar events, 4200 through the end of 1993. During the seven years of its existence, the facility has been used extensively for the following three primary purposes:
2. Routine Data Processing and Flare Determination
On a daily basis, the complete LAD, CONT, and DISCSP data sets are downloaded from the BATSE computer at MSFC to our computer at GSFC over the Internet. Orbital plots of the DISCLA rates, similar to the plot shown in Figure 1, are made and scanned for solar events. Once an event is identified and verified to be of solar origin, its characteristics are cataloged and all of the data during the flare interval are archived. The database is usually current to within two days of the observations.
Observations made with the BATSE instrument are recorded at the Operations Control Center at GSFC. After accumulating 24 hours of data, the data are copied to the BATSE principal investigator group at MSFC. Data technicians process the data files to create a variety of data sets. We use the following five types of data made accessible to us through a proxy account:
The DISCLA orbital plots are used by the GSFC data technician to identify
count rate increases due to solar flares. Once the data technician finds
possible flares in the orbital plots created during the previous night,
she then uses a flexible, interactive graphics program to verify their
solar origin. The determination of solar or non-solar origin is based primarily
on whether the count rate increases in the separate detectors are consistent
with their orientation with respect to the Sun. Ancillary consideration
is given to the timescale of variations, its energy spectrum, and correlative
increases in the soft X-ray flux seen by the GOES spacecraft. Also, the
increase in the counting rate due to the flare in the most sunward pointing
detector must be at least 100 counts s-1 for inclusion in the
flare database. When an event is determined to be solar in origin, the
data technician visually determines the start and end time of the flare
and of the intervals to be used for background determination before and
after the flare. The software then automatically calculates the background-subtracted
peak rates and total fluxes including rough corrections for the zenith
angle of the Sun in each detector. The software assigns a flare number,
enters information about the flare into the catalog, and creates an archive
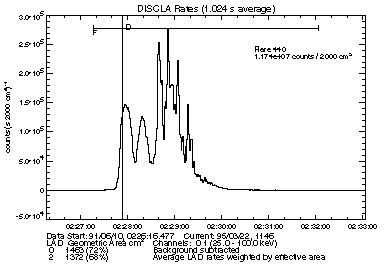
flare plot file. The archive plot for flare #445 is shown in Figure 2.
It is a standard format plot of Channels 1 and 2 for the two most sunward-pointing
detectors. Background subtraction, overflow correction, and livetime correction
are done for each detector separately, and then the rates are combined
by weighting according to each detector's effective area. Background during
the flare is determined by a linear fit over background regions selected,
when possible, immediately before and after the flare. A Flare Database
(FDB) file, DISCSP file, and CONT file are created for the flare as a subset
in time of the BDB file. The FDB file contains all of the data in the original
BDB file for time intervals containing solar flares and their associated
pre- and post-flare backgrounds. An example of a flare listing for June
10, 1991 is shown in Table 1.
Since the start of the mission, we have continuously enhanced the package
to make more data and better analysis software readily available over the
Internet. Now the graphics and data storage formats are all device independent,
all data and analysis products are available over the World Wide Web and
by anonymous FTP, and archives of high spectral and temporal resolution
solar flare products are also available. The flare high resolution data
products are collected from the archives of the COSSC and BATSE teams.
We have also developed the software to display all of these data sets in
the form of light curves. Software hooks are provided for each data set
in the spectroscopy analysis routines. We plan to continue enhancing the
facility at a low level-of-effort to increase the flexibility of the WWW
interfaces.

Figure 1. Number of solar flares detected with the BATSE LADs per day
corrected for observing time for the period April, 1991 through February,
1998. Each bin covers 2 days.

Figure 2. An example of an archive flare plot. The archive flare plot
is a standard format plot of Channels 1 and 2 for the two most sunward-pointing
detectors. Background subtraction, overflow correction, and livetime correction
are done for each detector separately, and then the rates are combined
by scaling by each detector's effective area. The horizontal bar near the
top of the plot indicates the duration of the flare. The vertical bar shows
the time of the corresponding burst-trigger and the upper x-axis is labeled
with seconds relative to the burst-trigger. Note that not all flares that
we record generate a burst-trigger.
3. On-line Data Access
All of the data products mentioned above (except the BDB files containing
the complete DISCLA data) are available to the solar physics community.
(Through agreement with the BATSE Principal Investigator, J. Fishman, this
facility is not to be used for anything other than solar research.) The
FDB flare files, quicklook plot files, and archive flare plot files for
the almost 5000 flares detected so far, as well as the BATSE flare catalog
and the daily event files are on-line and available at all times. Remote
users have access to the data products described above by either logging
onto a captive or guest account, displaying files through the WWW
interface, or by copying files using FTP to their system for local display
and analysis. When logging onto an account, the user is notified of the
ten flares most recently cataloged and presented with a menu of options.
>From this menu, the user may display parts of the BATSE flare catalog,
display archive flare plots or quick-look plots, plot selected intervals/detectors/channels
from the FDB, CONT, or DISCSP files, dump raw or livetime- and overflow-corrected
rate data for selected times, or display help files. After generating any
kind of display - flare list, plot file, data dump, or help file - the
user has the option to have the list-file or plot-file electronically mailed
to himself in order to read the dump data and manipulate it locally, or
to make hard copies on local printers.
Below we present several tables showing the scope of the archive:
| Data |
|
|
|
|
|
|
|
|
| FDB (DISCLA) |
|
|
|
|
|
|
|
|
| CONT |
|
|
|
|
|
|
|
|
| DISCSP |
|
|
|
|
|
|
|
|
| MER |
|
|
|
|
|
|
|
|
| TTS |
|
|
|
|
|
|
|
|
| DISCSC |
|
|
|
|
|
|
|
|
| SHERB |
|
|
|
|
|
|
|
|
| HERB |
|
|
|
|
|
|
|
|
| LEVEL 1 ONLINE | COMMENTS |
| CATALOG | Menu Driven, Select on Peak Rates, Times, or Burst Number |
| QUICK-LOOK ORBITS | Menu Driven, Multi-Trace, orbit and 24 hour format |
| FLARE PLOTS | Menu , FTP, or WWW select, GIF and PS formats. |
| IDL Solar Software Tools Online | Category | Availability |
| GEN | All Purpose | WWW, FTP, SSW-MIRROR |
| CGRO/BATSE | Light Curves, Catalog | WWW, FTP, SSW-MIRROR |
| SPEX | Light Curves, Spectroscopy | WWW, FTP, SSW-MIRROR |
| Database | Update Frequency | Purpose |
| GRO Pointing | 1 Month | Detector Aspect |
| Ephemeris | 1 Month | Dat/Night Crossings |
| High Voltage Off | 1 Month | On Fraction |
| Telemetry Gaps | 1 Month | On Fraction |
| SLLD & SLLD2 | 1 Month | DISCSP Channels |
| SPEC Gain | 3 Months | SPEC PHA |
| CALIB Lines | 3 Months | SPEC PHA |
| SPEC Response | Yearly | Photon Response |
| LAD Response | Yearly | Photon Response |
| LAD Gain | 6 Months | LAD PHA |

| BATSE Event | Start Date yy/mm/dd | Start Time hhmm:ss | Peak Time hhmm:ss | Duration (sec) | Peak rate (counts / s/2000cm^2) | Total Counts (counts) | Burst Trigger # | Triggertime (seconds of day) |
| 440 | 91/06/10 | 0227:16 | 0228:51 | 287 | 276710 | 11739691 | 307 | 8865 |
| 442 | 91/06/10 | 0240:19 | 0141:32 | 280 | 2920 | 252014 | 0 | 0 |
| 443 | 91/06/10 | 0300:006 | 0300:16 | 42 | 1369 | 11917 | 0 | 0 |
| 444 | 91/06/10 | 0402:51 | 0404:46 | 144 | 473 | 18994 | 0 | 0 |
| 445 | 91/06/10 | 0441:39 | 0442:45 | 521 | 28381 | 1437140 | 308 | 16949 |
Table A-1. BATSE Flare List Example This table shows a listing of archived flares observed with BATSE from 02:00 through 05:00 UT on 10 June 1991. The first column lists our archive event number, the second column is the date of the flare, the third lists the start time in UT, the fourth is the time of the peak in the flare time profile, the duration is in seconds determined by operator inspection, the fifth column is the peak count rate which is background-subtracted for the flux below 100 keV and has been normalized to the value expected for a single BATSE detector directly facing the Sun, the sixth column gives the total number of counts integrated over the duration of the flare determined in the same manner as for the peak rate, and the last column shows the time in seconds into the day of the corresponding burst trigger.
Personnel
The quick-look and archival system for solar flare hard X-ray data from the Burst And Transient Source Experiment (BATSE) on the Compton Gamma Ray Observatory (CGRO) is an integral part of the Solar Data Analysis Center (SDAC) at Goddard Space Flight Center. The effort is directed by GSFC scientist Dr. Brian Dennis in the Laboratory for Astronomy and Solar Physics. Dr. Dennis has over 18 years experience in the detection of solar flare hard X-rays and in the analysis and archiving of the data. He was PI for the Hard X-ray Burst Spectrometer (HXRBS) that recorded over 12,000 flares during the 9.75-year lifetime of the Solar Maximum Mission (SMM). Dr. Richard A. Schwartz provides the scientific oversight and A. Kimberley Tolbert manages the software development effort. Dr. Schwartz and Ms. Tolbert were also members of the HXRBS team.