Data Processing: Photometry
All point- and extended-sources with signal-to-noise ratios > 3 are included within the catalogue. These ratios are determined from simple aperture photometry whereas source magnitudes are calculated with a chain of aperture photometry, coincidence loss/deadtime corrections and curve-of-growth extrapolations.
Point Sources
Standard, unweighted aperture photometry is performed on each candidate point source within a detector-coordinate image. Bad pixels recorded in the quality map (Data Processing: Bad Pixels) are ignored during the pixel summation. The aperture for a point source is a circle of radius 12 unbinned pixels, or with a pixel scale of 0.47 arcsec/pixel, 5.6 arcsec. The background is a 7.5−12.2 arcsec (8−13 pixels) circular annulus. The background annulus is adjusted slightly for all binned data to ensure that the background aperture is 2 full image pixels from the source aperture. If source apertures of neighbouring objects encroach upon either the background or source regions then all contaminated pixels are ignored in the aperture summation.
If the signal-to-noise ratio of an object < 10, the source aperture is reduced in size to a 2.8 arcsec radius circle in order to improve the significance of detection. Reduced-aperture source counts are corrected to their 5.6 arcsec equivalent using a curve-of-growth extrapolation of the calibrated point-spread function (PSF), stored and distributed by the XMM-Newton mission.
Before converting source counts to a physical magnitude or flux scale it is necessary to correct for potential photon-coincidence losses. This effect is identical to pileup in X-ray detectors and occurs because the position and arrival time of each photon is measured on-board but only to within the accuracy allowed by the readout speed of the detector. Readout speed is 11ms for a full frame image although this will decrease if the detector hardware is windowed to reduce its active area. So confusion occurs when two or more phtons arrive together both in time and location on the detector. The centroiding algorithm described in the modulo-8 fixed pattern correction section cannot distinguish multiple events, counting instead just one photon when multiple events actually occurred. The brigher a source, the greater the coincidence losses. The effect is non-linear but has been calibrated using photometric standards. All sources can be corrected for coincidence losses although uncertainties become unquantifiable as the source count rate approaches 1 / frame rate. The theoretical correction for coincidence losses and detector deadtime is:
| Cth = −ln(1 − αCraw) / α | (2.1) |
Craw and Cth are the raw and theoretically corrected count rates, α is the frame time. However it is not possible to perform a theoretical coincidence loss correction on individual image pixels because confused photon splashes skew on-baord event centroiding from the true photon location on the image and this is further confused by the mod-8 fixed pattern bias. So not only is the count rate underestimated in bright sources, but the individual event positions are also incorrectly determined. An empirical correction is therefore performed based on a 5.6 arcsec (optical) or a 11.2 arcsec (UV) aperture, using a correction calibrated from photometric standard fields of point sources. The empirical correction is performed on the theoretical count rate:
| Ccor = γ(αCraw)Cth / (1 - β) | (2.2) |
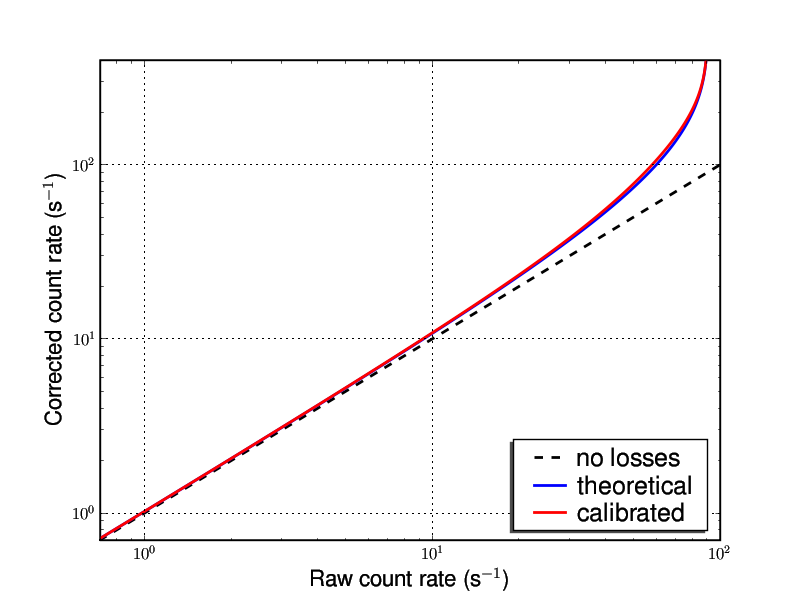
where γ(x) = 1 + 0.075673x − 0.143986x2 + 0.638497x3 − 0.570184x4, x = αCraw and β is the deadtime fraction between frames. Figure 1 illustrates both the theoretical and calibrated correction curves. When calculating Ccor the correction must be based on the raw count rate provided by both the source and the background within the source aperture and the rate within the background aperture is also corrected. The corrections are therefore performed before subtracting the background from the source counts.

Fig 1: The blue curve is the theoretical coincidence loss correction as a function of raw count rate, assuming a full frame image, frametime = 0.0110329s, deadtime fraction = 1.58%. The red curve is the empirical correction curve constructed using photometric standards.
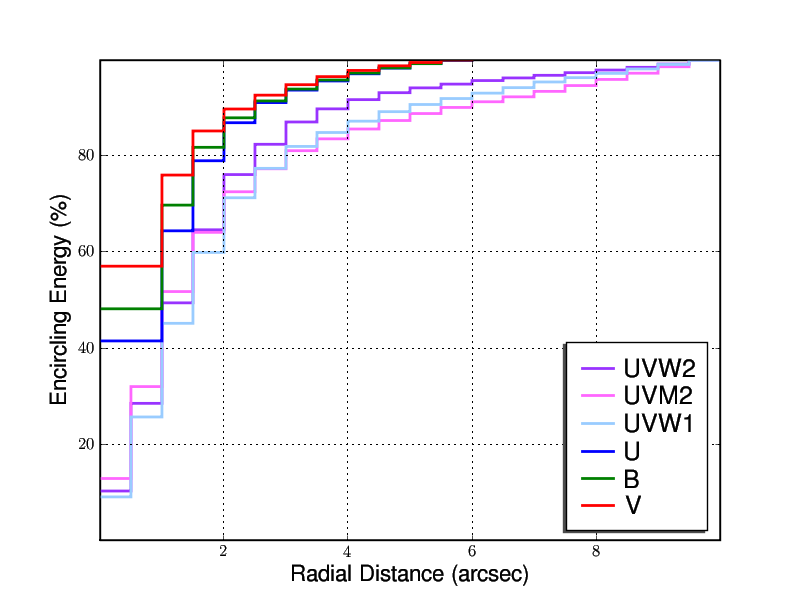
The requirement to extract source counts within a 6.0" aperture is not for photometric accuracy but instead governed by the need to provide raw aperture photometry over the same sized region used to calibrate the coincidence loss polynomial. While the optical filter PSFs are all well-contained within a 6.0" aperture, the UV PSFs are not. Figure 2 provides nominal PSFs for the six catalogue filters, contained within the Calibration Access Layer of the XMM-Newton project. Therefore additional curve-of-growth corrections are applied to UVW2, UVM2 and UVW1 sources after the coincidence losses are corrected to produce count rates out to a radial distance of 17.5".

Fig 2: Nominal PSFs of the six XMM-OM broad band filters used in the catallogue. Nominal means sources of low count rate and negligible coincidence loss.
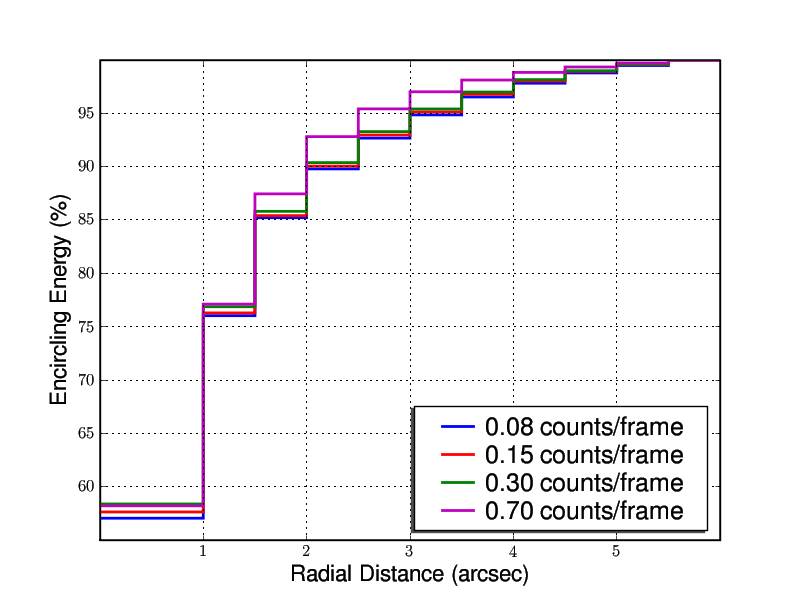
Because of coincidence losses, PSFs vary with count rate and all curve-of-growth correction factors are count rate-dependent, e.g. Fig 3. The XMM-OM photometry software interpolates across a grid of count-rate and filter-dependent PSFs in order to make curve-of-growth corrections.

Fig 3: The V filter point spread function varies with count rate because of coincidence losses. The count rates are summations over a 6.0" extraction aperture.
Regular calibrations indicate that there is no measurable variation in the photometric zeropoints over time or as a function of detector position. Source magnitudes are calculated from the simple expression:
| mf = zf - 2.5 log(Ccor) | (2.3) |
where mf is the filter-dependent source magnitude and zf is the zeropoint provided by the XMM-Newton current calibration file. Similarly, source AB flux is calculated using:
| Ff = AfCcor | (2.4) |
where Ff is the filter-dependent flux and Af is the rate-to-flux conversion factor. A summary of Vega and AB zeropoints and AB flux conversion factors is provided in Table 1.
| Filter (f) | zf (Vega) | zf (AB) | Af (AB) |
|---|---|---|---|
| mag | mag | 10-15 erg cm-2Å-1count-1 | |
| UVW2 | 14.87 | 16.57 | 5.700 |
| UVM2 | 15.77 | 17.41 | 2.210 |
| UVW1 | 17.20 | 18.57 | 0.482 |
| U | 18.26 | 19.19 | 0.194 |
| B | 19.27 | 19.08 | 0.125 |
| V | 17.96 | 17.92 | 0.250 |
Table 1: Zeropoints and AB flux conversion factors for each lenticular XMM-OM filter.
Extended Sources
The aperture for extended source photometry is source-dependent and irregular, containing all pixels associated with the object during the prior source detection operations. All clustered pixels > 2σ above the background are considered to be the same source. Bad pixels recorded in the quality map (Data Processing: Bad Pixels) are ignored during the pixel summation. The raw pixel background level is taken to be the outlier- and source-filtered mean within a 100/δx square box, centred on the object, as used during source detection.
Coincidence loss corrections for extended sources have an unknown systematic error (known issue) because event centroids have a different and empirically-unquantifiable distribution compared to point sources. Coincidence losses are calculated for each individual pixel using a 6.0" aperture centred on the pixel. Both source pixels and background are corrected, and the source count rate Ccor is the summation of all corrected pixels within the source aperture minus the inferred summation of corrected background within the aperture.
Both zeropoints and flux conversion factors for extended sources are identical to those used in 2.3 and 2.4. The magnitudes and fluxes quoted in the catalogue are integrated over the whole aperture, rather than provided per unit area (Known issue).
SAS task: omdetect, ommag
CCF product: OM_PHOTTONAT_000n.CCF (coincidence), OM_COLORTRANS_000n.CCF (zeropoints)