
MSSL Astrophysics Group Beginner's Guides
A Beginner's Guide to Spectroscopy
Most forms of light that we see are not actually one colour, but made up of a mixture of many colours. If we see coloured light, it's usually because one colour is dominating so we don't see the others.
The colour itself is actually light of a given wavelength, and light, or the electromagnetic spectrum, can have wavelengths which range from the radio to gamma-rays. Our eyes can only see a very small part of the spectrum, the `visible' region.
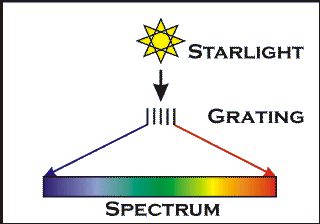
Making a spectrum
White light is therefore a mixture of light of many colours. We can `split' this light up into its separate colours using a prism or a diffraction grating and of course Nature does this in beautiful style, fanning out sunlight into a rainbow, using raindrops as millions of tiny prisms.
Light of a given wavelength carries a given energy. Light at long wavelengths has low energy, while at shorter wavelengths, in X-rays for example, the energy that the light carries is very high. Whilst in optical telescopes, gratings are used to spread out the light, in X-ray telescopes the instruments record the separate energies of the incoming light. Therefore we can measure spectra using different techniques at all wavelengths.
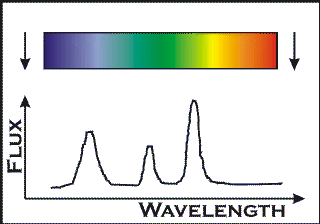
Measuring the `shape' of the light
Having spread the light out into a spectrum, we can then measure the brightness of the light at each wavelength. This gives us the more familiar one-dimensional spectrum that physicists use.
Imagine that you have spread the light out into a spectrum as shown opposite. Then you simply move along the spectrum measuring the brightness at each point. Before CCD chips recorded spectra electronically in two dimensions, this was done by scanning a photometer along the length of the spectrum. Now, a 2-D image of the spectrum is recorded on a CCD, astronomers use computers to simply add up the amount of light `downwards' at right angles to the direction of dispersion.
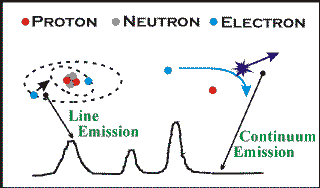
The features in a spectrum
There are two main types of features observed in spectra, lines and continua. The continuum is the smooth underlying trend that the spectrum follows and is the large-scale emission produced by the gas or plasma, for example a star emits a thermal blackbody continuum, while some supernova remnants emit a continuum produced by relativistic electrons spinning in a magnetic field. The diagram shows the continuum emitted from a hot, low-density plasma. In this plasma, the electrons are free from the protons, but as a free electron encounters a proton, it’s attracted towards it because of its opposite charge, and slows down. As it slows down, it loses energy and, because energy has to be conserved, this is given up in the form of light. This continuum-emitting process is known as `bremsstrahlung radiation'.
The lines are the peaks and troughs (only peaks are shown here) superposed on the continuum. The `peaks' are called emission lines and occur in the `shake-up' of the structure of an atom (or ion - essentially an atom with some electrons missing). An atom is made up of a nucleus (composed of neutrons and protons) with electrons in surrounding orbits. Each type of atom can only have electron orbits at discrete levels around the nucleus and the electrons, in the absence of external influences, will always want to shuffle-down to fill the lowest levels. If an electron gets pushed up to a higher level, either in a collision or because it absorbs energy from passing light, then eventually it will fall back down again, giving off a discrete amount of energy in the form of light. This light has a certain energy, thus a certain wavelength, and is emitted at one point only in the spectrum and a line is formed.
Emission lines tell us much about the nature of an astronomical source. They tell us how far away they are because of the effects of cosmological redshift, they tell us what elements are present in the gas and how much there is of each element, how fast the gas is moving, its temperature and density, etc.
Thus spectroscopy reveals details that images alone could never provide.