Figures for the visual grism : nominal
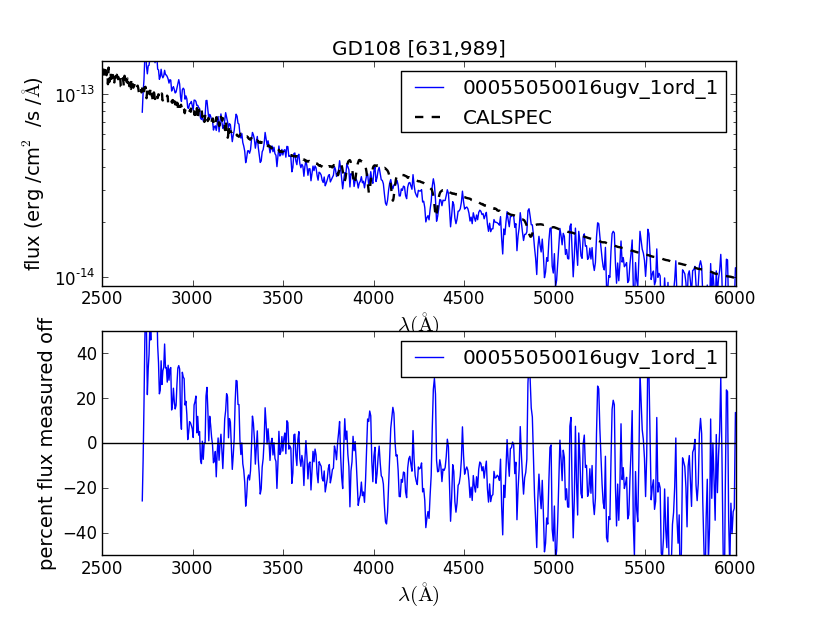
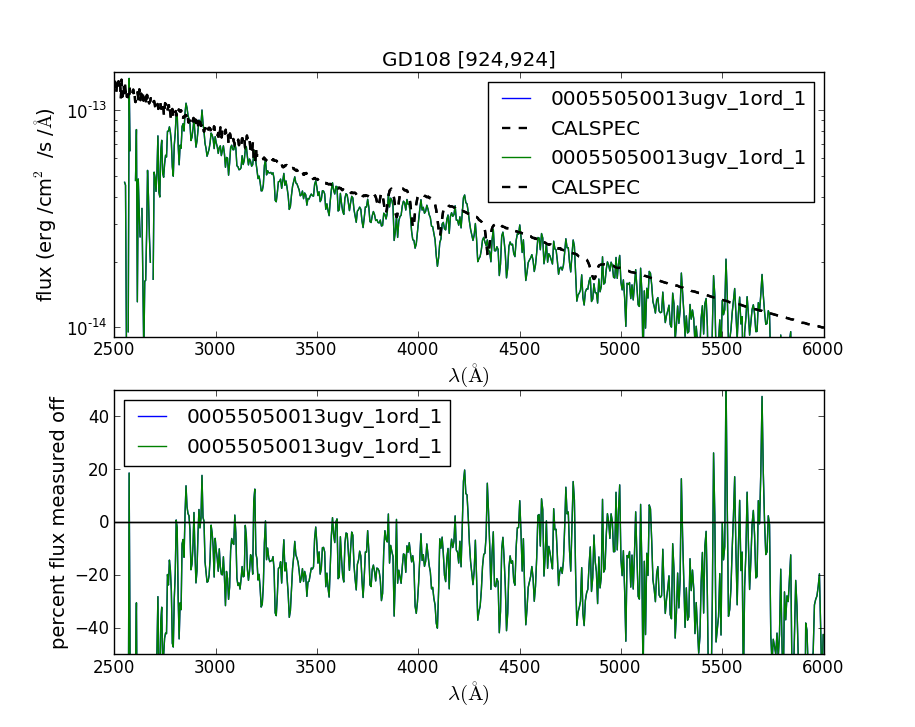
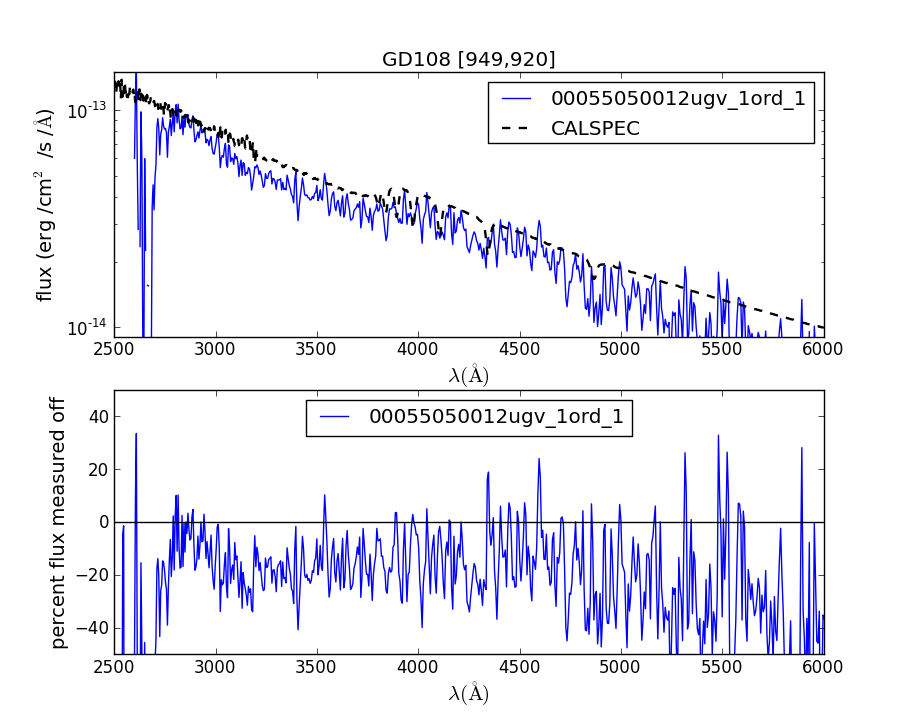
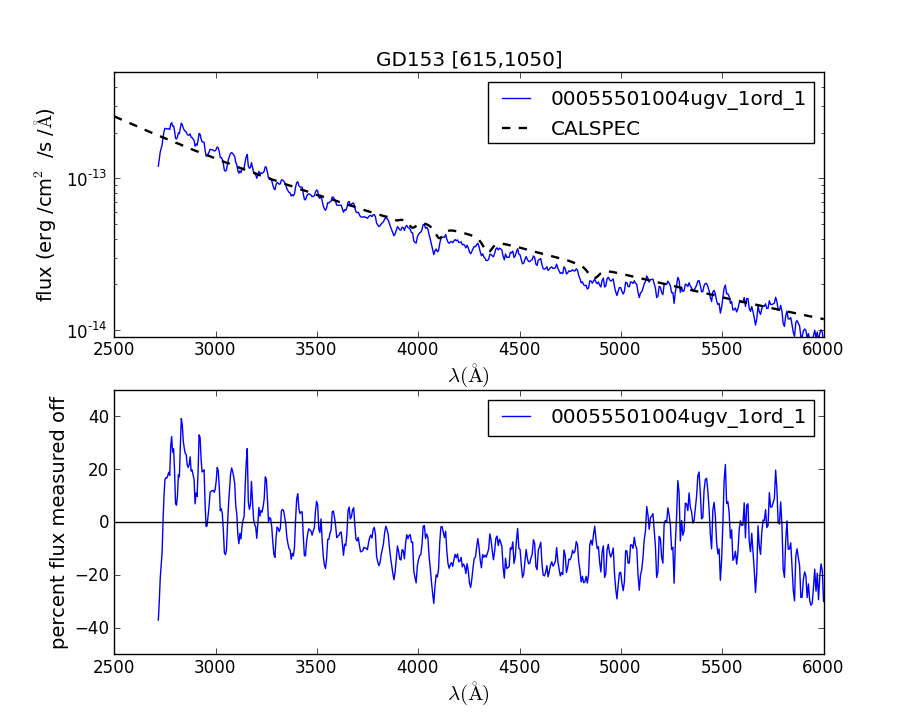
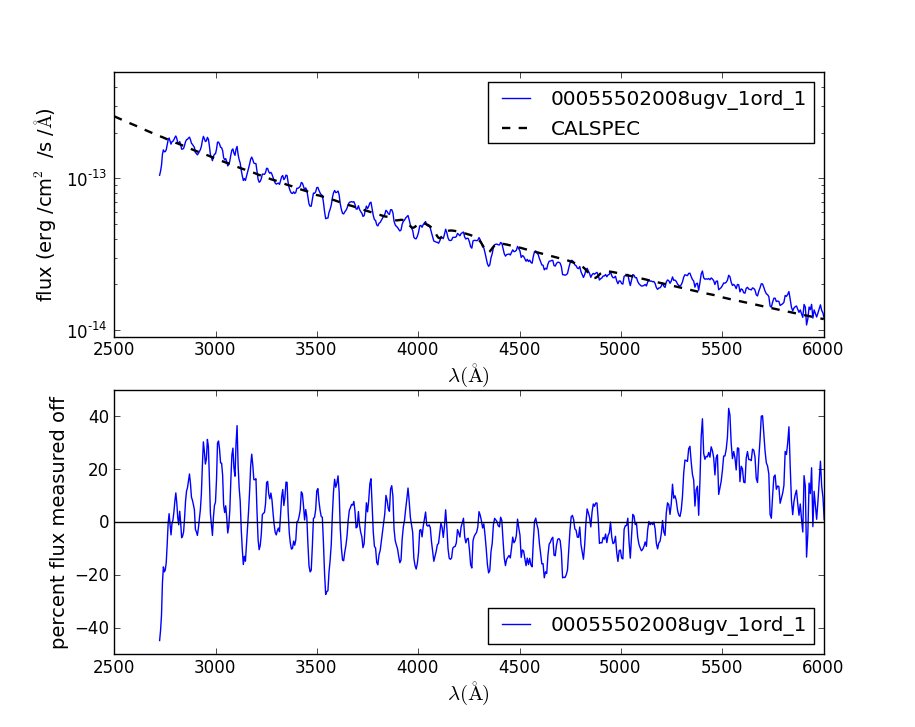
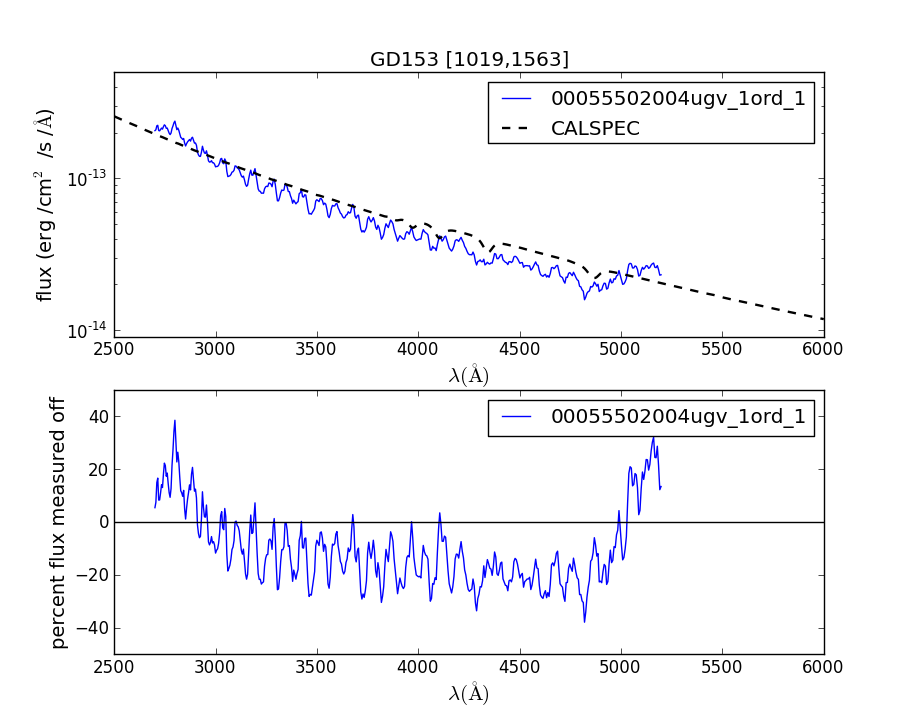
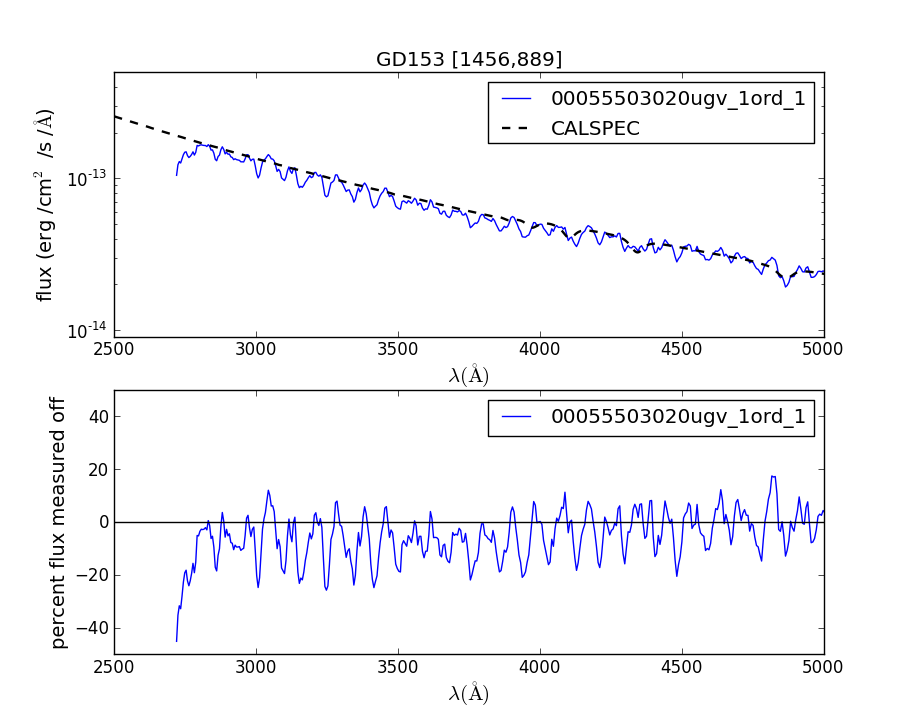
These figures go with the description Verification of the flux calibration in the visual grism: nominal mode, and show in the top panel the observed flux and the reference spectrum which is usually taken by HST.
In the bottom panel is plotted (observed - reference)/reference as a percentage. Notice that the bottom plot gets very noisy when the source flux is low. This is due to noise in the data. Also, at longer wavelengths second order contamination raises the observed flux, setting in at a wavelength that depends on the location of the blue rise of the spectrum.
WD1121+145 spectra (DA)
WD1121+145 Figure 1
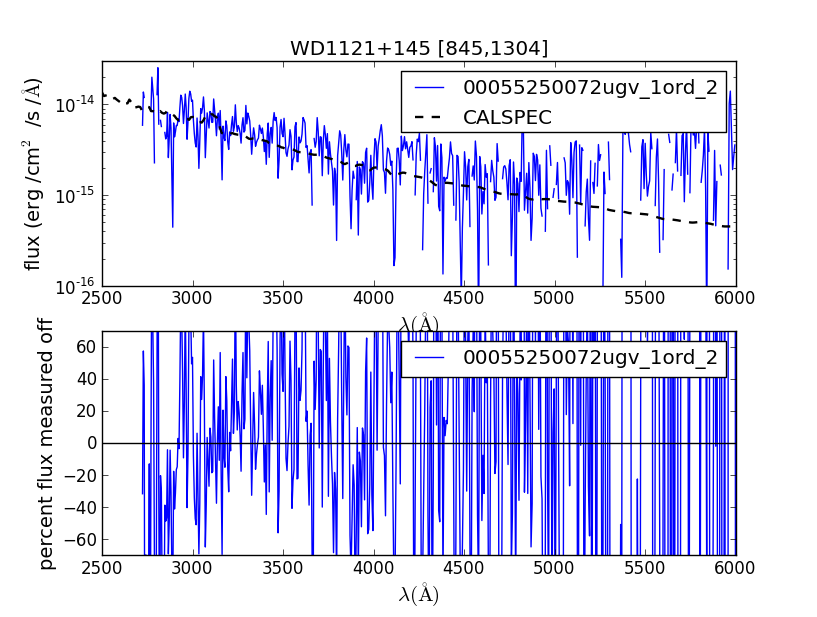
This spectrum with anchor at [845,1304].
WD1121+145 Figure 2
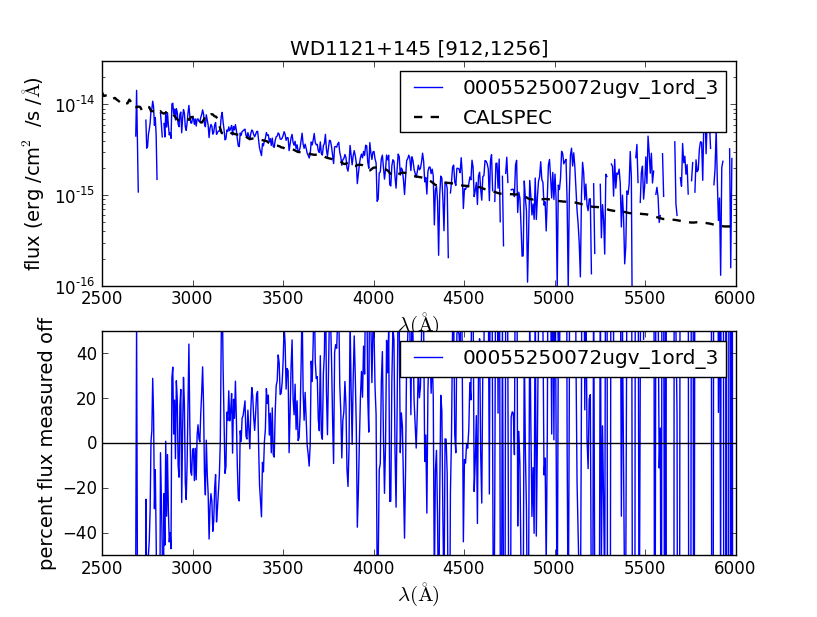
This spectrum with anchor at [912,1256].
WD1121+145 Figure 3
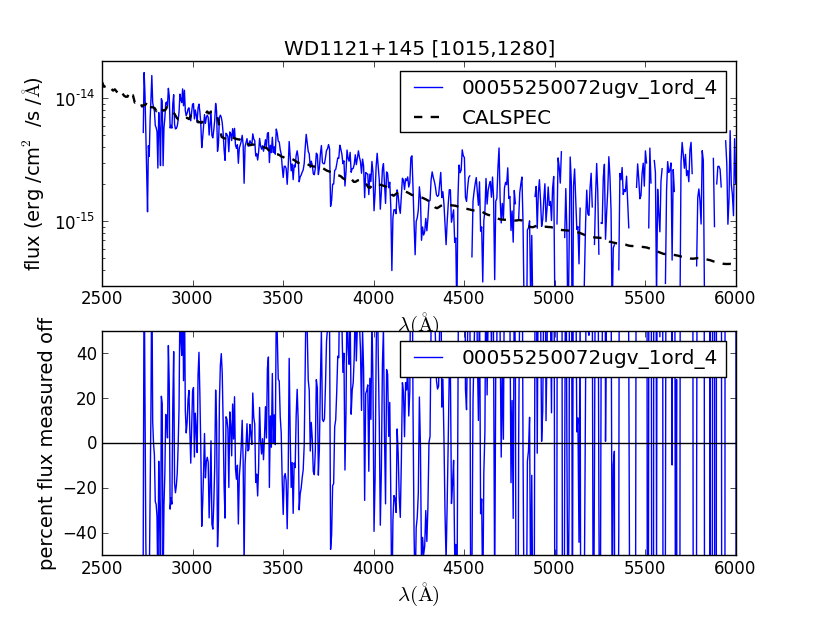
This spectrum with anchor at [1015,1280].
WD1121+145 Figure 4
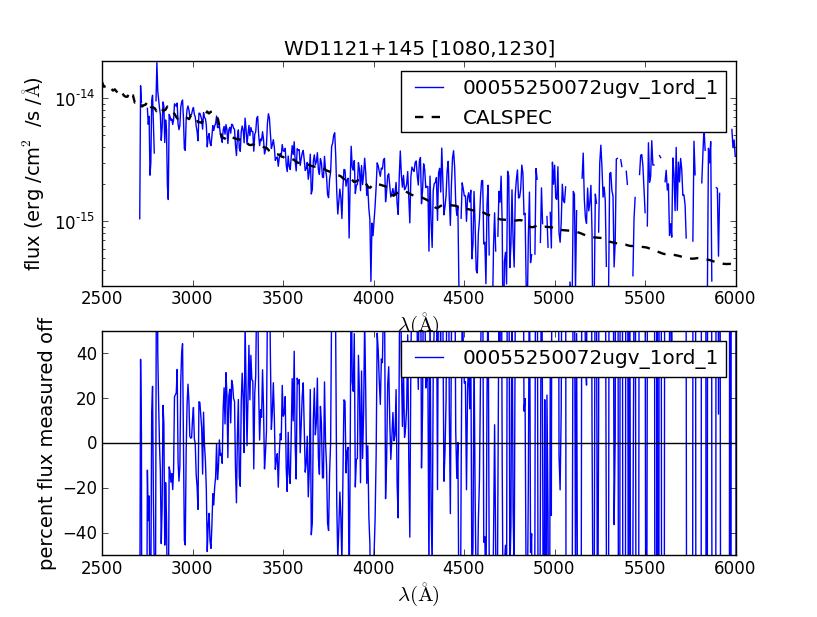
This spectrum with anchor at [1080,1230].