Introduction
Let's begin by explaining that the data coming from the satellite are not completely processed currently before being archived, and that the data processing software in the FTOOLS is an early version. A more sophisticated FTOOL is under development which will incorporate the wavelength calibration across the detector (not just the centre region); track curved spectra in the UV grism during extraction; attempt to extract or estimate the second order spectrum; extend the flux calibration over a larger area of the detector; and include a better response matrix using the PSF predicted by the optical model for the instrument.
The following topics will be covered:
- check that your data has been processed for MOD8 correction and the distortion correction has been applied so that the grism detector image is aspect corrected in the WCS-S system.
- [if you need to] processing the grism image to get a MOD8 and aspect corrected detector image.
- determine your source position RA and DEC in the USNO-B1 catalog, if possible.
- Extract the spectrum using uvotimgrism. This needs some iteration which is explained here.
- make the response file.
- plot the spectrum using XSPEC
- plot the spectrum using IDL
- plot the spectrum using Python+pylab+pyfits
- How reliable is the extracted spectrum. Discussion of accuracy, features, order overlap and contamination.
1. The way to test if the data has been processed correctly, is as follows:
Assume that our file name is sw00044444001ugu_dt.img, and the image
is in the first extension. We want to work with the detector image for
extracting the spectrum. I assume that the latest HEASOFT software and
UVOT CALDB has been installed on your system, so that you can use the
commands shown below in a terminal window.
- Check if the MOD8 correction has been applied:
ftlist sw00044444001ugu_dt.img+1 hk include="MOD8CORR, ASPCORR"
If the keyword MOD8CORR = T,
then you don't have to apply the mod8 correction and can directly
proceed from the detector image. I'll show in section 2.1 below
how to do that. If you just want a quick spectrum to look at you can
use an image which has not been corrected for MOD8 pattern noise.- Check if the aspect correction includes the distortion correction:
2. In case your detector image has not been processed all that way, here follow my instructions how to do it yourself.
2.1 To do the MOD8 correction.
Make sure you have downloaded the attitude file, and the raw file. There are several versions of the attitude file. The first version has the string *sat*, but the latest updated version has the string *uat*. Let's say I copy them to the directories that Swift normally adopts, and start running the reprocessing from the uvot/image directory. Then the files are something likeattitude: ../../auxil/sw00044444001uat.fits
raw data: sw00044444001ugu_rw.img
Make sure the files have been decompressed.
Make the bad pixel file, mod8 corrected raw image.
uvotbadpix infile=sw00044444001ugu_rw.img badpixlist=CALDB outfile=sw00044444001ugu_bp.img compress=yes clobber=yes history=yes chatter=1
uvotmodmap infile=sw00044444001ugu_rw.img badpixfile=sw00044444001ugu_bp.img outfile=sw00044444001ugu_md.img mod8prod=NO mod8file=sw00044444001ugu_mm.img nsig=3 ncell=16 subimage=NO xmin=0 xmax=2047 ymin=0 ymax=2047 clobber=yes history=yes chatter=1
Now find the following parameters in the header RA_PNT, DEC_PNT, PA_PNT:
ftlist sw00044444001ugu_rw.img+0 hk include="RA_PNT,DEC_PNT,PA_PNT"
Use these values in the next command to convert from raw image to detector coordinate image:
swiftxform ra=RA_PNT dec=DEC_PNT roll=PA_PNT infile=sw00044444001ugu_md.img outfile= sw00044444001ugu_dt.img attfile=../../auxil/sw00044444001uat.fits alignfile=CALDB method=AREA to=DET teldeffile=CALDB bitpix=-32 aberration=n seed=1 copyall=n cleanup=yes chatter=1 history=yes clobber=yes
2.2 Do the aspect /distortion correction
Now you will need the following file (or use fhelp catspec to see an example) and copy it to your directory.find $HEADAS/../.. -name "usnob1.spec" -print
cp heasoft-6.10/attitude/tasks/tristarid/StarID/usnob1.spec ./
Do the distortion/aspect correction. Previous to the UVOT CALDB of 2011-01-31 the distortion file (swugrdist20041120v001.fits ) was not present. Versions later than HEADAS 6.10 will automatically locate the distortion file in the CALDB.
uvotgraspcorr infile=sw00044444001ugu_dt.img outfile=aspcorr.fit catspec=usnob1.spec distfile=CALDB chatter=1 cleanup=yes history=yes
Check that the roll correction is less than about 3". If it is larger, you need to update the attitude file with uvotattcorr using the aspcorr.fit file you just generated and start from the beginning with your updated attitude file. For example, the commant ftlist aspcorr.fit T prints the results out.
Besides correcting the aspect solution, uvotgraspcorr also models the grism-specific distortion by including cubic astrometric terms in the FITS header (using the "SIP" convention – see http://ssc.spitzer.caltech.edu/postbcd/doc/shupeADASS.pdf). The reason the distortion is modeled rather than removed is that the very long first order spectra do not follow the same distortion pattern as the zero-orders used to define the astrometry.
Now we can generate a sky image for the grism which is useful for blinking with the lenticular filter (white,u,b,v,uvw1,uvm2,uvw2) images. This one differs mainly by having the aspect correction done, but not the distortion correction, since that only applies to the zeroth orders in the WCS-S system.
swiftxform ra=RA_PNT dec=DEC_PNT roll=o.o infile=sw00044444001ugu_dt.img outfile= sw00044444001ugu_sk.img attfile=../../auxil/sw00044444001uat.fits alignfile=CALDB method=AREA to=SKY teldeffile=CALDB bitpix=-32 zeronulls=NO aberration=NO seed=-1956 copyall=NO extempty=NO cleanup=yes chatter=1 history=yes clobber=yes
So now we have a good grism image that can be used to best effect with the spectral extraction routine.
3. Determine the RA, DEC of the objects position in the USNO-B1 catalog
This is not absolutely necessary, but can give you a better match to the coordinate solution used in the UVOT.
The reason is as fillows: the Swift attitude system provides positions with an accuracy of about 3". So to get better positions, the field stars in the image are matched up with the USNO-B1 catalog. It is possible that an object position is listed elsewhere with slightly different numbers due to biases between the USNO-B1 and other catalogs.
To do this, use the scat program which is part of the WCSTOOLS distribution and is included in HEADAS. For example, input source coordinates in the command and the nearest source is returned:
scat -c ub1 -ahd 12:10:13.1 +31:15:11.3
scat WCSTools 3.8.1, 14 December 2009, Doug Mink SAO Find closest star
USNO-B1.0 182.5545833 31.2531389 J2000 r= 0.03 at epoch 2000.0000
USNO_B1_number RA2000 Dec2000 MagB1 MagR1 MagB2 MagR2 MagN PM NI SG Arcsec
1212.0194738 182.5696375 31.2549667 19.92 18.65 18.99 19.16 18.48 0 5 0 46.79
The h is for header; d for decimal degrees.
In this case, I put in some random coordinates, and the star found is some huge distance off, but it serves to show how it is done.
Use the coordinates it returns. The uvotimgrism routine accepts decimal degrees.
I find it useful to make a region file for use in DS9 with the WCS-S system. Open the detector image in DS9. In the region coordinate system select "WCS-S". Bring up a region anywhere and double click to edit. In the 'coordinate' tab select 'multiple WCS' and 'S'. The fill in the coordinates of your source. Save that region file. It should look like:
# Region file format: DS9 version 4.1
# Filename: /Volumes/data/grb/110213A/00445414992/uvot/image/sw00445414992ugu_dt.img[gu319267311I]
global color=green dashlist=8 3 width=1 font="helvetica 10 normal" select=1 highlite=1 dash=0 fixed=0 edit=1 move=1 delete=1 include=1 source=1
wcss;fk5
circle(02:51:51.401,+49:16:23.56,11.0516") # color=red text={GRB}
The region file will sit on the zeroth order of your spectrum in the detector image. You can then use that to quickly see if there is a first order present.
Use the _sk image to check whether the GRB spectrum is contaminated by any unrelated spectra. Overlay a star catalog to see if there is any contamination by stars. Or Analysis → Image Servers and match frames. Make a box region file on the first order and overlay it on the catalog image to see where the contaminating stars are. Note that there will be a small offset because the sky image does not have distortion removed.
4. Extract the spectrum using uvotimgrism. This needs some iteration which is explained here.
Now we have the input data in the right shape, we can start extracting the grism image. I always display the ftools help file, since there may have been updates. So do fhelp uvotimgrism. Now the help file should display in firefox or whatever browser you have, and look down list all the options. I usually go down the list and pick the ones I want. Now one of the issues with this program is, that the typical width used for the extraction box is rather big. However, the spectrum of the UV grisms has some curvature, so to get it all fitted in a smaller box requires some iterations. We will not bother with that now and use a nice wide box to include all of the spectrum, especially the most juicy part, the UV.
uvotimgrism infile = sw00030366011ugu_dt.img+1 outfile = sw00030366011ugu_1.pha backfile = sw00030366011ugu_1_back.pha badpixfile = None ra = 267.5548792 dec = -6.7079417 ang =144.5 wavemin=1650 wavemax=5000 srcwid=30 bkgwid1=30 bkgwid2=30 bkgoff1=45 bkgoff2=45 inreg=sw00030366011_1.reg nsigma=5 cleanup=yes chatter=1 clobber=yes history=yes
The explanation is as follows: The infile is the detector image of the grism. Notice that you are required to specify an extension for the grism image to be processed.
Now, two output files are useful further on in the processing, and the naming matters. I included "_1" in the name of the outfile, backfile, and region file (inreg) to tag the extension of the image used. So if the extension were 3, I would use "_3". The "_back.pha" part of the background file is useful if you use XSPEC or IDL programs from Wayne Landsman for further processing.
The bad pixel map does not really matter much, since there are hardly any bad pixels in the UVOT images. Remember , these are not CCD images, but maps built up from a photon detector. The optimal RA,DEC positions to be used I discussed in section 3. Note they need to be in decimal degrees.
The angle of the spectrum on the detector is different for each detector mode. The value depends on the grism mode and is best set to 144.5 (U grism clocked), 151.4 (U grism nominal), 140.5 (V grism clocked), or 148.1 (V grism nominal). If the spectrum is close to the edge of the detector you may need to experiment with the angle, since it varies across the detector. The second order starts overlapping the first order around 2800A in the UV detector. But there is a lot of spectrum longward of 2800A in the UV detector. Similarly, in the V detector, the second order starts around 4500A. However, the second order is much weaker than the first order, 2-10% typically, so that is only a worry for blue sources. Elsewhere in these pages you will find more details on that. The current flux calibration or the UV grism does not extend above 4900A, and between 3000-4900A there may still be some issues which are under investigation. The V grism calibration is considered to be fine. The PSF of the grism becomes very extended and has a horse-shoe shape at the red end. Data longward of 4900A may be usable, but currently we have not a good calibration. I prefer a background further away from the spectrum than about 30 pixels to avoid any effects of coincidence-loss/mod8 patterning from the grism spectrum itself. The optimal position for a particular observation depends on the positions of contamination of zeroth orders. Although the extraction throws away outliers, a better background starts with a good positioning.
Once you have run uvotimgrism, bring up the detector image in DS9, and plot the region file. It will show you if you have
positioned your extraction and background boxes correctly. I found it useful to sometimes use asymmetric backgound region parameters because that will cause the extraction box to be a bit asymmerically placed. It is useful for including the curved UV spectrum and excluding contaminating sources. So fiddle away! By the way, the UV part of the first order spectrum is the part closest to the zeroth order.
This is the iterating bit, and I think you will need to experiment a bit.
The wavelength equation in the CALDB is only valid within a couple of hundred pixels of the zeroth order location of the boresight X = 1448, Y =703. The wavelength equation (and to a lesser extent the sensitivity) changes with detector position especially as one moves to small X and large Y, and there is increasing curvature in the spectrum. The future grism extraction program under construction will be able to address the changing wavelength equation and such across the detector.
The flux calibration has been done with a 21 pixel wide box. In the UV grism, the FWHM of the spectrum in the direction across the spectrum is about 6.4 pixels. The shape of the spectrum across the dispersion direction is very well fit by a gaussian. So if you use a very tight extraction box, some flux may be lost which must be accounted for.
5. make the response file.
If you intend to use XSPEC, you will need a response file. There is a program that will create one from the output file from uvotimsum.
uvotrmfgen spectrum=sw00030366011ugu_1.pha outfile=sw00030366011ugu_1.rmf areafile=CALDB lsffile=CALDB chatter=1 clobber=yes
The lsffile is not really implemented yet, it is just assuming indepent pixels while in reality the PSF is over several pixels. This will be fixed in a future release.
6. plot the spectrum in XSPEC
Now that you have the spectrum, background file, and response file, why not plot it?
XSPEC
data sw00030366011ugu_1.pha
resp sw00030366011ugu_1.rmf
iplot
device /xw
plot
hardcopy
Of course, there is a lot more that you can do with XSPEC.
Now, the error in the raw data is mainly Poisson noise (modified a bit in the presence of coincidence loss, see Kuin and Rosen, 2008. ) However, correcting for the distortion means that the counts in nearby pixels get rearranged, which decreases the noise. So typically a noise reduction of 30-60% occurs. This may show up later, when fitting, as a too good chi-squared statistic. Be aware of that.
7. Using IDL
The .pha file created by uvotimgrism contains 3 extensions. The first (SPECTRUM) stores the spectrum in counts and is meant for use with XSPEC. The second (CALSPEC) extension stores information about the spectrum including the wavelength (FITS column LAMBDA), absolutely calibrated flux (FLUX), and error (FLUX_ERR). This extension can be interrogated with FITSIO tools to obtain a reduced spectrum. The third (IMAGE) extension contains a subimage including the zero and first order rotated so that the dispersion direction is (roughly) along the X axis. One can view these spectra with your favorite tool (e.g. FV, IDL, IRAF).fdump infile=sw00336489000ugu_2.pha+2 outfile=sw00336489000ugu_2.txt columns=LAMBDA,FLUX,FLUX_ERR prhead=no rows=- clobber=y pagewidth=150
edit the text file to comment out the column headers and remove any lines with INDEF.
IDL> rdtable,’sw00336489000ugu_2.txt’,table
IDL>plot,table[1,*],table[2,*]
IDL>ploterr,table[1,*],table[2,*],table[3,*]
IDL> binup,wave,flux,3,binwave,binflux
If you can see the break, use the equation in part II, no. 11 to calculate the redshift.
Display image/spectrum on the monitor
IDL> imgrism,'sw00336489000ugu_1.pha'
Create a postscript file sw00336489000ugu_1.ps
IDL> imgrism,'sw00336489000ugu_1.pha',/ps
Create a png file sw00336489000ugu_1.png
IDL> imgrism,'sw00336489000ugu_1.pha',/png
Wayne Landsman has made these IDL programs for further manipulating the UVOT spectral data. They are available from the from this site under "current grism software", or else from Wayne.
8. Plot the spectrum using python+pylab+pyfits
If you have Python installed with at least 'pylab' and 'pyfits', you can use pyfits to read the output and pylab to plot the results. Here is an example using the ipython shell.
ipython -pylab
In [7]: import pyfits
In [8]: f = pyfits.open('sw00056950007ugu_2.pha')
In [9]: d = f[2].data
In[10]: h = f[2].header
Check the extension
In [11]: h['extname']
Out[11]: 'CALSPEC'
Get the wavelengths
In [17]: d.field('LAMBDA')
Out[17]:
array([ 1600.34558105, 1602.46850586, 1604.59399414, ..., 6779.42382812,
6784.93652344, 6790.45166016], dtype=float32)
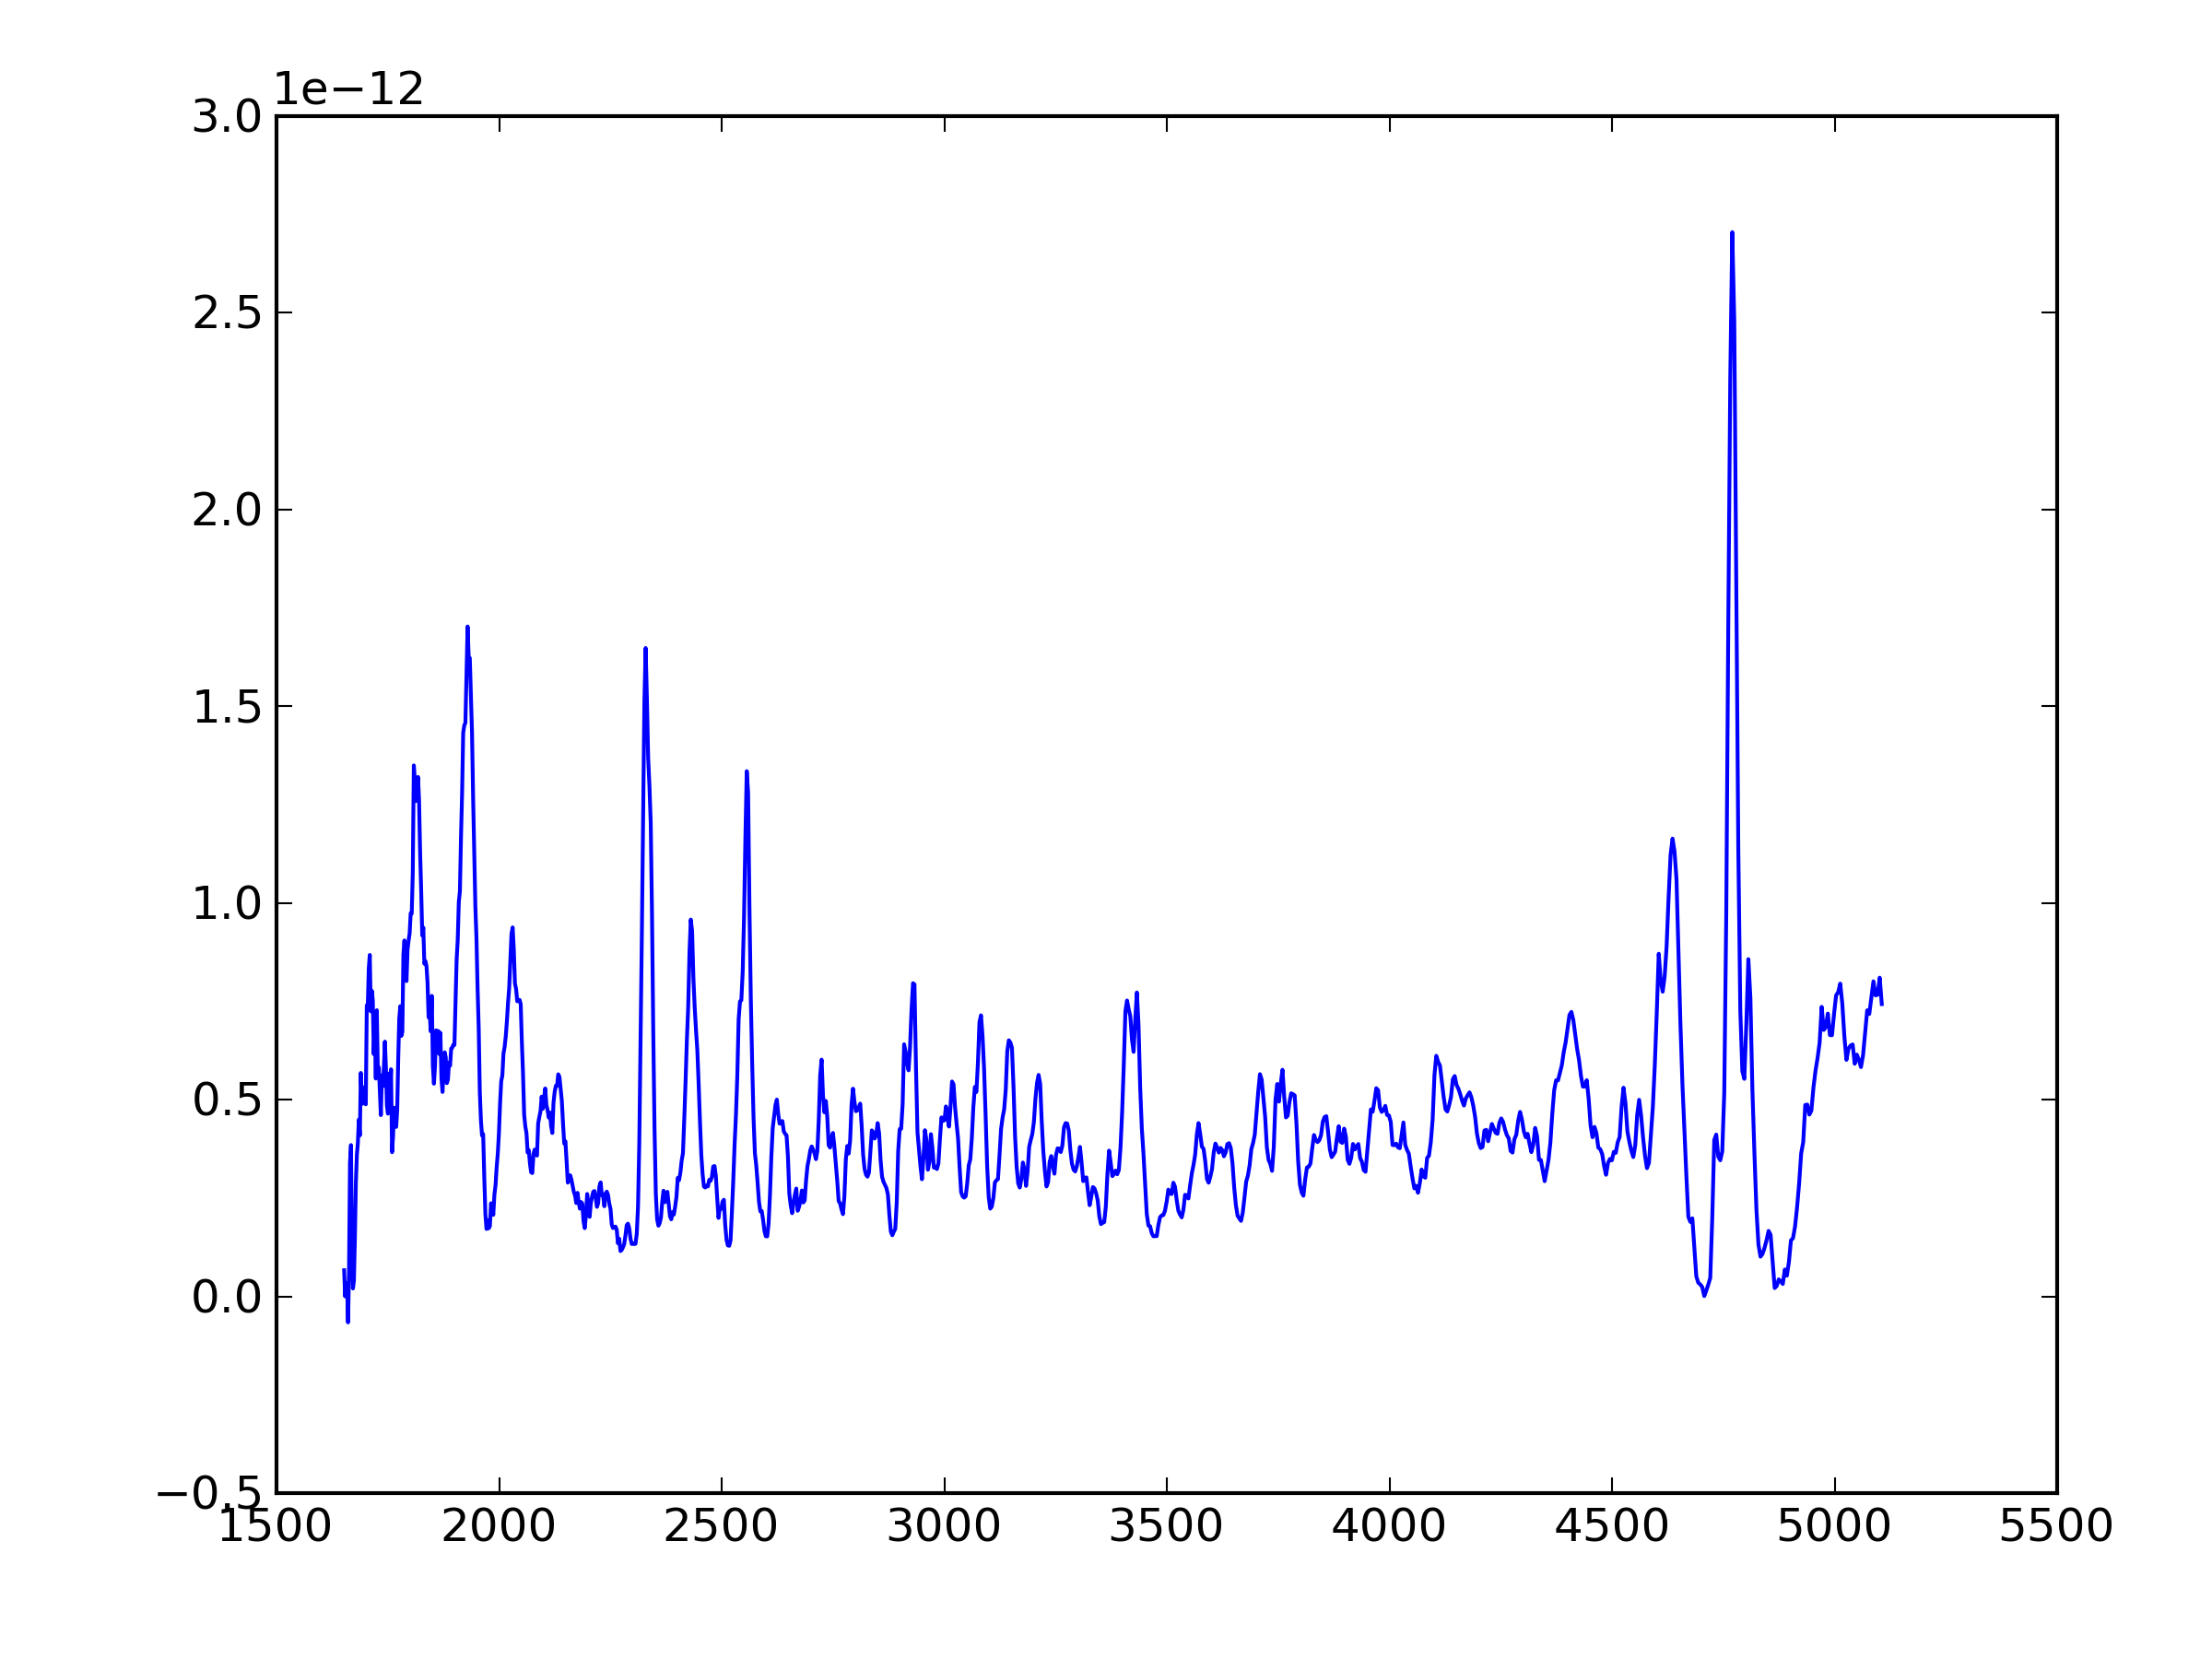
plot the spectrum
w = d.field('LAMBDA') ; net=d.field('net') ; flux=d.field('flux')
plot(w,net); clf(); plot(w,flux)
9. How reliable is the extracted spectrum. Discussion of accuracy, features, order overlap and contamination.
The flux calibration is better than 10% except when the spectrum (or spectral feature) get too bright. Very bright features cannot be measured correctly, because coincidence loss (also called pile-up in the X-ray community) happens. The detector had a finite frame time, and if more than one photon per frame hits the same pixel, there is only a yes/no result, so that multiple photons are counted as only one. Because of counting statistics, a correction can be made. However, the detector design is such that neighboring pixels are used in the measurement. This makes the effect of coincidence loss in the UVOT non-local. Also an anti-coincidence rejection is in place. For point sources this effect has been modeled and calibrated and is well-understood. But for spectra there may be some additional considerations due to the extended nature of the spectral track. That is still under investigation. For now, if a feature in the spectrum is measured with a 5" circular aperture like in point sources, and would have very high coincidence loss, say 6x, then the flux measurement is not reliable under applying the correction for point sources to the flux.
The wavelength accuracy has been discussed elsewhere for the new calibration. The current version of the old calibration using the zeroth order is of similar accuracy for spectra near the default position.
For red sources the order overlap is not an issue since the flux in the second order will be negligible. For blue sources it will be smaller than 10% at wavelengths above 2800 in the UV grism and 4500 in the V grism.
Zeroth orders of field stars may contaminate the spectrum. At the moment the best way to check that is to use the sky image for the grism in DS9 and blink it with a DSS image or an image in one of the lenticular filters. That will show the position of field sources on the grism image and will allow you to identify which features are due to source contamination.
