A Statistical overview of the wavelength calibration accuracy
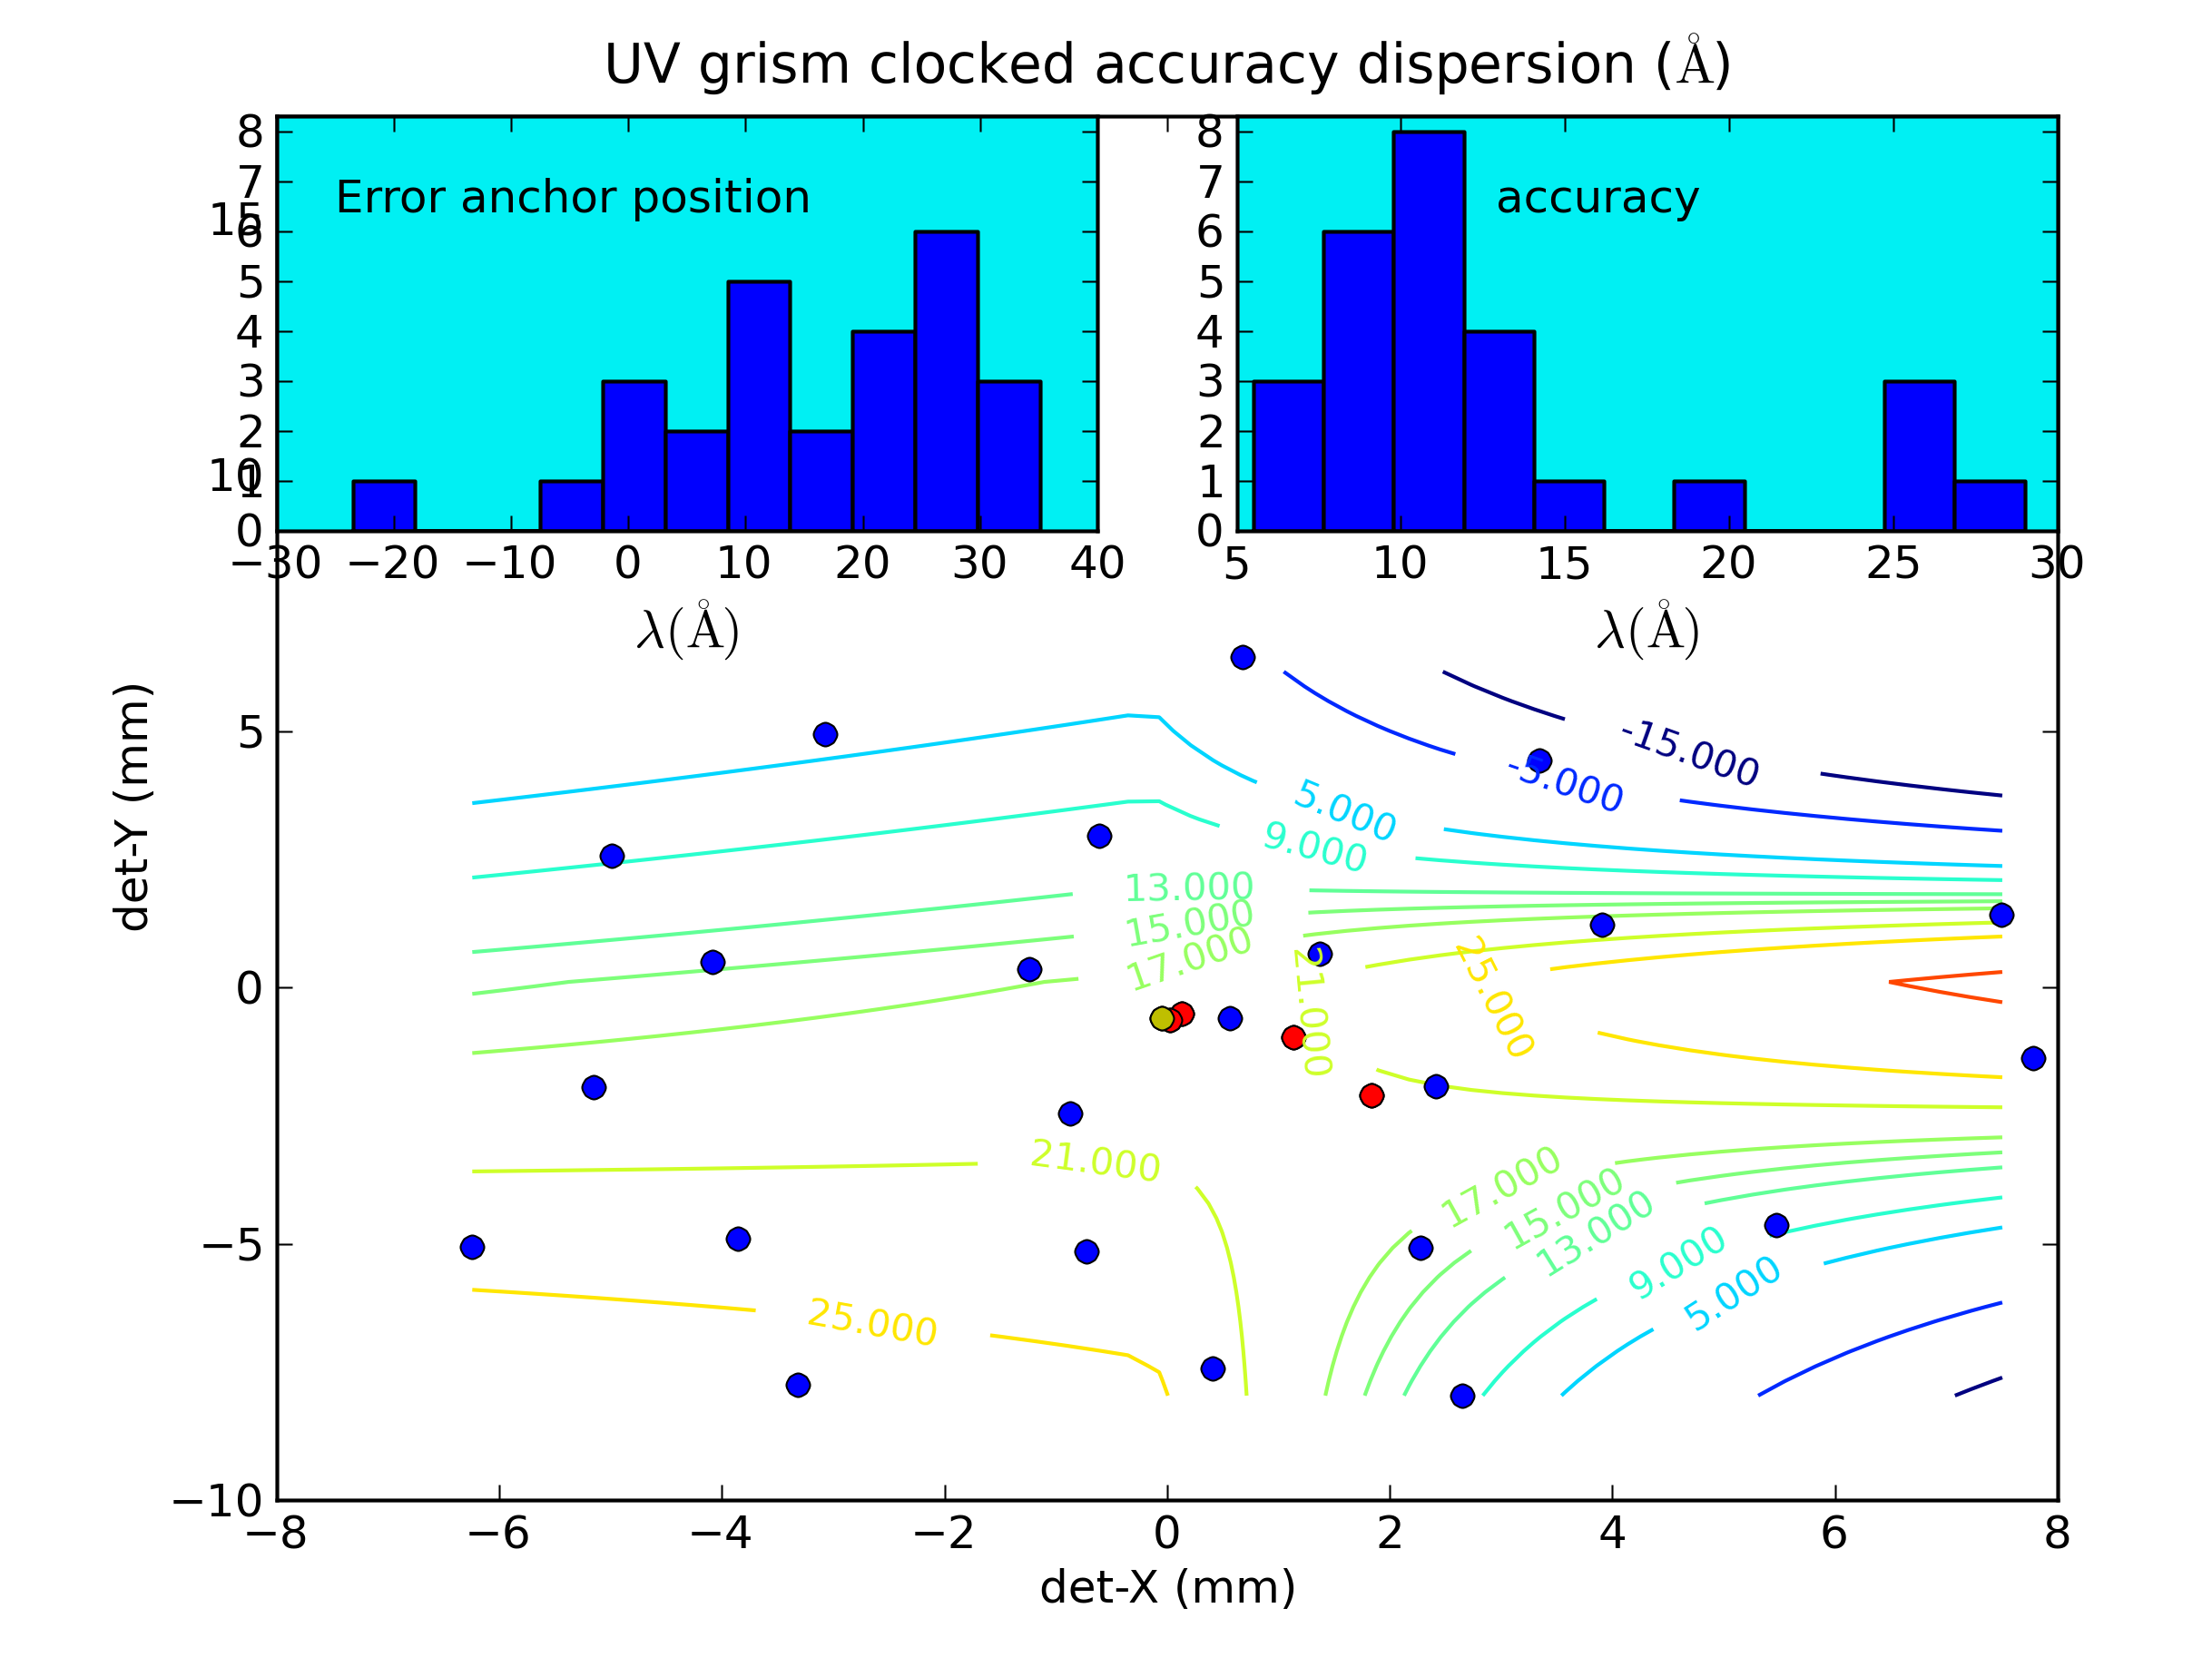
This figure shows the errors in the wavelength calibration. The blue
dots are the anchor positions (at 260nm in first order) of the
calibration spectra on the detector. The contours are a fit to the
accuracy of the dispersion expressed as the RMS error between measured
and predicted wavelength for known lines in the spectrum.
The inset in the top left corner shows that at most times the anchor
point
that was predicted using the source position in the lenticular filters
taken just before and
after the observation has a systematic offset of
15.9 A. Disregarding the systematic offset, the anchor position
typically falls within 23 A (about 7 pixels) of the
correct position. This is sufficient to avoid making misidentifications
of the larger spectral features which have a FWHM which is comparable
in magnitude.
The inset in the top right corner shows the accuracy of the adopted dispersion from the scaled zemax model after removal of the anchor point offsets as a root mean squared measure. The contours show the overall variaton over the detector. For details, the actual fits given in the maps on this page should be consulted. The main result is, that the RMS error in the wavelengths in a spectrum is typically less than 16 A, which is about 5 pixels.
How to read the wavelength accuracy plots
Wavelength accuracy plots were made for each useful calibration spectrum. The format of the accuracy plots is to have two panels. Since the main variation of the dispersion can be represented by a constant with a linear term, the top panel of the accuracy plot has taken those two terms out. The higher order terms tend to zero near the adopted anchor point, which for the V-clocked grism mode is ~4200 Å. The dispersion from the scaled optical model has been approximated with a polynomial. The observed line positions from lines identified in the calibration spectrum have been plotted as blue dots. The lower panel of these wavelength accuracy plots shows the remainder after subtraction of the predicted position. The observed position was found from the pixel distance to the anchor point and the dispersion relation, while the predicted position was found using the known wavelength. If the model dispersion is good, the difference can be divided into an offset and a random looking spread around that offset. The values for that case are given in the plot. In some points near the edges of the detector, the scaled model dispersion deviates and the points will not evenly be distributed around some mean offset.The upper left corner (low det-X, high det-Y) has no first orders because of the aperture effect from rotating the filterwheel.
A map for wavelength accuracy plots
The map below provides links to the wavelength accuracy plots.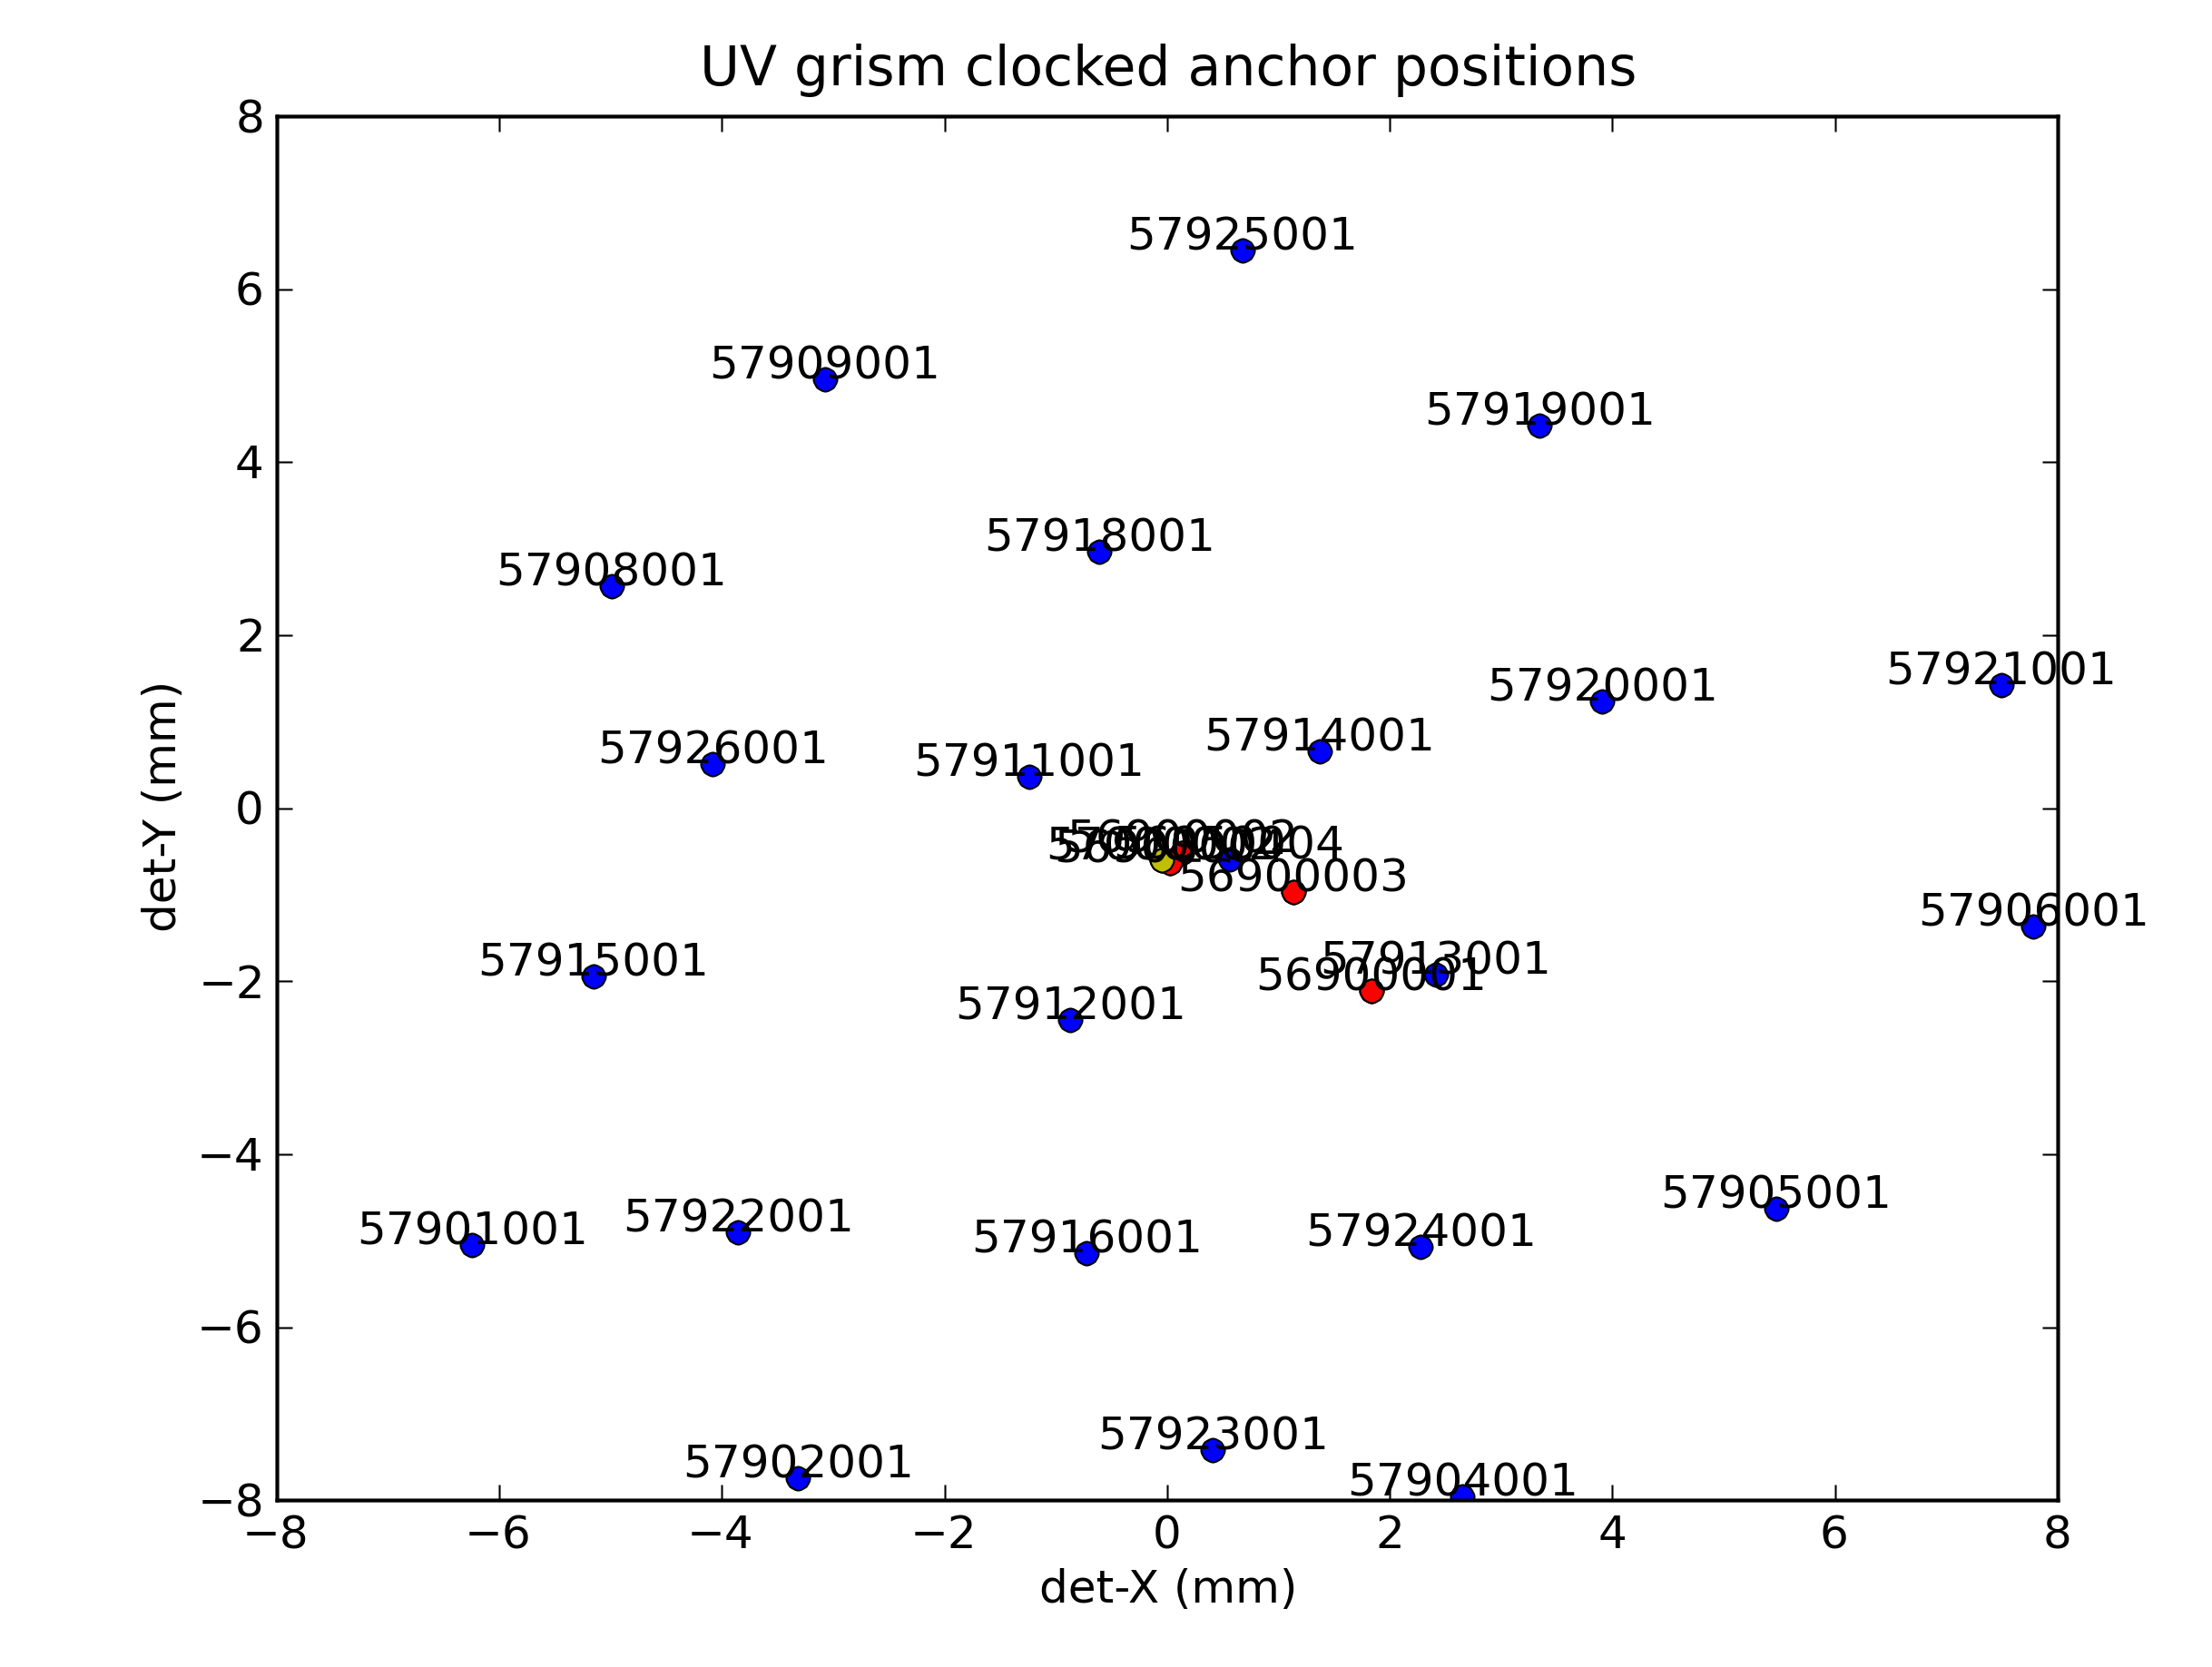
A Map for count rate spectra
Here the count rate calibration spectra can be found. The top panel as a function of fitted wavelength, the bottom panel as function of pixel coordinate. The stronger lines have been identified. Any shifts between the predicted line position and the actual spectrum can be seen in the top panel as an offset.
The count rate in the spectra can be seen to vary across the detector, which is partly due to variations in sensitivity, and perhaps also to variablility in the source, which was chosen for calibrating the wavelengths using the many spectral lines.
The calibration file used was swwavcal20090626_v2_mssl_uc160_wlshift6.1.fits. In some browsers the maps do not work. In that case the plots/images can be found here.
In part, the uncertainty in the position of the anchor point is due to a possible drift of the pointing during the observation which can typically be around 4 pixels, which for a dispersion of 3.2A/pixel translates to about 13A.
