XMM-OM n.v.technical note; Alice Breeveld 11/05/04
Eng 6 and the
Pulse Height Distribution
Engineering 6 mode
In this mode the gain and Pulse Height Distribution of the detector is measured.
Photons from an LED are reflected from the back of the blocked filter into the detector making a flat-ish field with a steady count rate. The LED level has been set low enough to avoid count rate dependent gain depression and coincidence loss but high enough to get reasonable statistics in a reasonable time.
The gain is the ratio of the output current to the input current. If only one initial electron is assumed, the gain is the number of electrons in the output charge cloud. The incoming photon can be thought of as equivalent to one electron so that the meaning of the term ‘gain’ is consistent.
The number of electrons in the output pulse varies from event to event because of the statistical uncertainty inherent in secondary electron emission and the depth of the initial photon interaction. In addition, the number of electrons produced by the first interaction with the MCP may vary, depending on the photon energy and incident angle. The amplitude distribution of the output pulses is known as the Pulse Height Distribution (PHD).
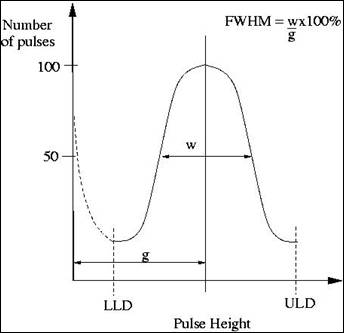
When the MCP bias voltage is too low for saturation, the amplitude distribution of output pulses is quasi-exponential. As the voltage is increased, the PHD can be seen to change as saturation is reached, from the quasi-exponential to a peaked distribution, with a low energy exponential tail. Normally the gain and FWHM of the PHD are quoted. The gain is the modal gain (‘g’ in the figure) and the FWHM is the half width of the distribution given in terms of the percentage of the modal gain. The peak can have a FWHM as low as 50%.
Note that saturation does not prevent the modal gain from increasing further with increased bias voltage; as the voltage is increased, a larger part of the last channel becomes saturated.
With the lower level discriminator (LLD) set to cut out the noise and the upper level discriminator (ULD) set at a level to cut out double events, most events will lie in the peaked part of the distribution. The number of counts detected during the eng6 exposure will be the number between the LLD and ULD, i.e. the integrated counts is related to the efficiency of the detector system. A small change in MCP gain, or voltage, provided it does not cause many events to fall below the LLD or above the ULD will not cause a change in the efficiency.
Gain depression
After an event has stripped electrons from the MCP walls, the channel takes a finite time to recharge. If an event arrives during the recharge period, the gain of the event is reduced. Thus at high local count rates, the gain is depressed, resulting in a non-linear count rate response across the detector. This can lead to distortions and ghosting in the image with some readout techniques. This is one reason for the OM count rate limits.
Another type of gain depression occurs gradually during use of the MCP as charge is extracted from it. This effect can be localised to an area which has had most use. Time under vacuum also reduces background noise, gain and to some extent the width of the PHD.
Reduction in throughput
In the OM we are seeing a small percentage wavelength dependent throughput reduction by comparing star counts from the beginning of the mission with more recent measurements. The wavelength dependence suggests either further contamination of the optics, detector window, or degradation of the photocathode.
In order to separate the causes of the degradation, we need to look at as many parameters as we can. We have:
- Position, peak and integrated counts in PHD. If the integrated counts reduces with time it may be due to a loss of gain, if the peak is low enough to be below the plateau region. Or else it could be due to reduction in output of the LED. Or due to photocathode degradation, or contamination of the detector window. It cannot be due to the optics because during eng6 the counts are from LED reflected on blocked filter.
- Change in count rates of real stars. This could be due to all of the above, plus possible contamination in optics.
Differences between these two measurements might tell us something about optics. LED does not give any UV.
Before changing MCP voltage
If PHD is still in plateau region and the voltage is changed a small amount (either up or down), electron paths are changed and the scrubbing has to start again. And we would have to recalibrate. (which we have to do anyway because of degradation.)