
Summary of the Swift UVOT grism properties
The Ultraviolet(UV) and Optical Telescope on board the Swift mission provides images of a field 17x17’ large on the sky, with a spatial resolution of 0.5” in seven filters, two grisms, and a magnifier. The information below documents the latest information of the UVOT Grisms for the redundant optics which have been used since start of operations. The magnifier is out of focus in the operational configuration and has not been used. The grisms are mounted on a filterwheel and can be used in two modes called ‘nominal’ and ‘clocked’ as explained elsewhere.
Summary of capabilities
| Visual grism properties | values |
|---|---|
| Spectral resolution | 100 at 4000Å |
| Effective wavelength range (first order) | 2900-6600Å |
| wavelength accuracy | 12Å (see note a) |
| order overlap second order to first | 5700Å in first order |
| effective magnitude range | 13-17 V mag |
| astrometric accuracy (first order anchor point) | 1.2 arcsec |
| scale | 0.57 arcsec/pixel |
| dispersion | 5.9 Å/pixel at 4200 Å |
| coincidence loss above (depends on background) | ~10^{-13} erg/cm2/s/Å |
| zeroth order magnitude zero-point | 17.7 mag (note b) |
| UV grism properties | values |
|---|---|
| Spectral resolution | 75 at 2600Å (note a) |
| Effective wavelength range (first order) | 1730-5200Å (note c) |
| Effective wavelength range (second order) | 1700-2250Å |
| Effective wavelength range (zeroth order) | 3600-5500Å |
| wavelength accuracy | 22Å (see note a) |
| order overlap second order to first | >2750Å in first order (note d) |
| effective magnitude range | 11.5-15.5 V mag |
| astrometric accuracy (first order anchor point) | 3.5 arcsec |
| scale | 0.57 arcsec/pixel |
| dispersion | 3.2 Å/pixel at 2600Å |
| coincidence loss above (depends on background) | ~5x10^{-13} erg/cm2/s/A |
| zeroth order magnitude zero-point | 19.0 mag |
Notes:
(a) The coincidence loss correction reduces the spectra resolution for bright features with significant coincidence loss to 30 Å
(b) The magnitude zero point given here for the zero order is the isophotal magnitude.
(c) The UV range extends up to 6700Å, however, past 5200Å the broad PSF and low sensitivity make the data generally not useful.
(d) The order overlap for large offsets of the source on the detector starts at much longer wavelengths, for example , for an offset of (0,5.6) arc minutes on the detector the overlap starts to be noticable at 4500 Å.
Some example data:
Raw Images: UV image and grism of the same field.
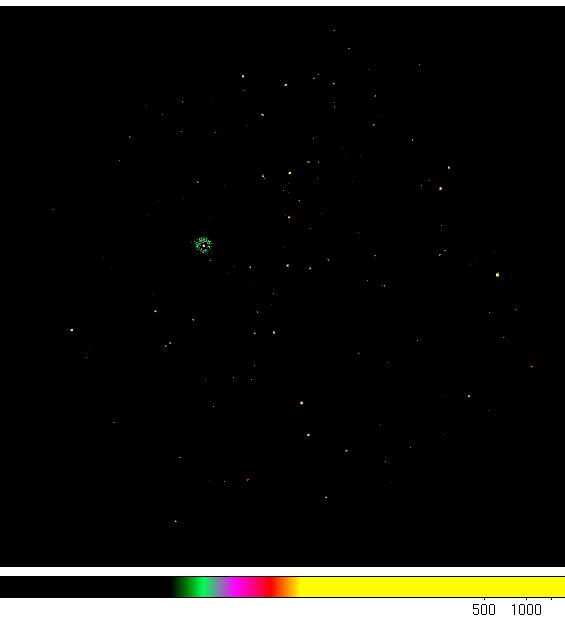
The field of which the uv grism is taken.
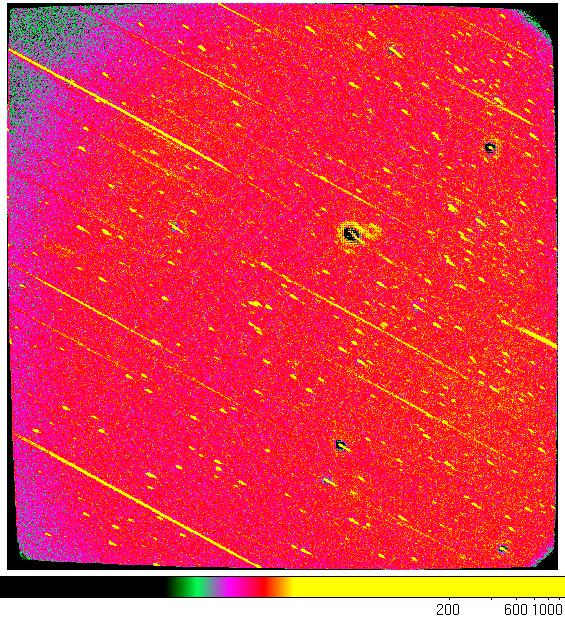
This is the grism in the nominal mode.
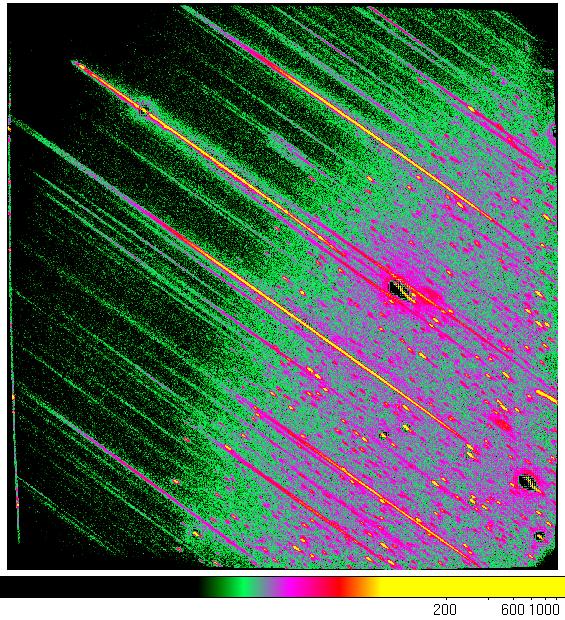
This is the grism in the clocked mode.
Raw images: V image and Visual grism of the same field.
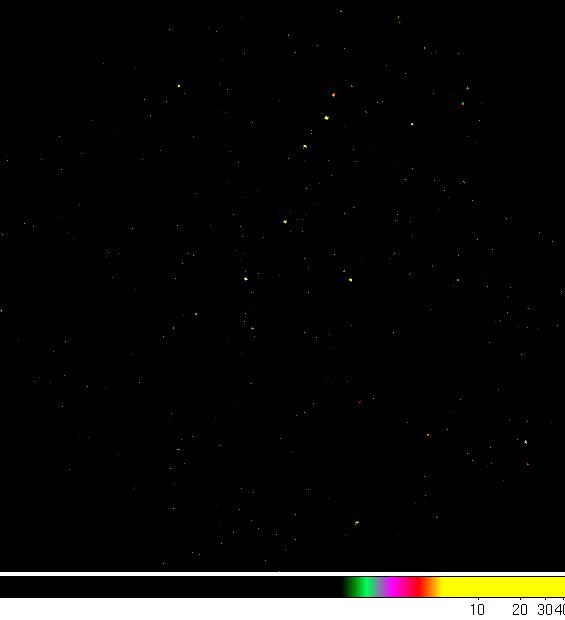
This is the field of which the visual grism image was taken.
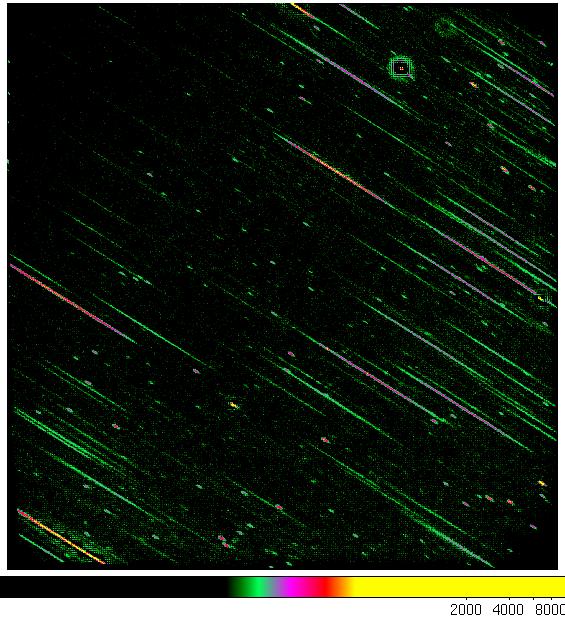
This is the visual grism image in the nominal mode.
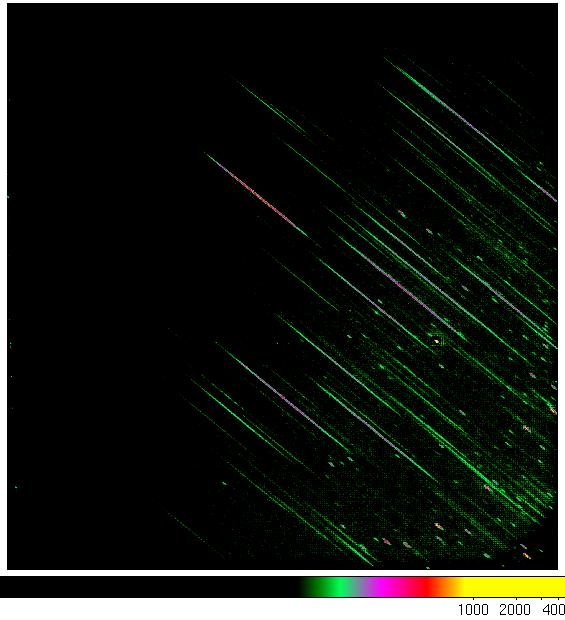
This is the visual grism image in the clocked mode.
Most noticable are the differences between the nominal and clocked mode.
The small dotty streaks are zeroth orders of sources. In the clocked mode the zeroth orders are confined to only part of the detector image. In addition the background is also more prominent where the zeroth orders are. Since in long exposures the background can drive up the effect of coincidence loss, and in bright fields sometimes avoid data loss from buffer overflows, the clocked mode is usually the best for observing.
More difficult to notice is that in the UV grism some of the spectra are slightly curved and a partial separation of the second order from the first order in the top right and bottom left corners of the image. In the V grism part of the second order is sometimes found as an extension of the first order. UV bright sources in the UV grism can show a separated UV tail to the zeroth order.
Some first orders on the detector have no accompanying zero order. In that case the zero order did fall outside the detector. In fact, because the grisms were optimised for the first order, the first orders fall mostly on the detector, but part of the zero orders do not. In rare cases, a minus one order is present in the UV grism on the right hand side of the image as a thick streak.
If a source is bright, the zeroth order will present a large halo, with a modulo-8 pattern. That is due to the combined effect of the coincidence loss of the detector and the on-board detection algorithm. If a source is very very bright, the first order may also degenerate into a mod-8 pattern and nearly all spectral and flux information will be lost.