D-Region Absorption
 The normal mode of radio wave propagation in the HF range is by
refraction using the ionosphere and by a combination of
reflection and refraction between the ground and the F-layer for
multiple hops. The HF radio propagation window is the range of
frequencies between a Lowest Usable Frequency (LUF) and a maximum
Usable Frequency (MUF). This window varies by location, time of day,
season and with the level of solar and/or geomagnetic activity.
The normal mode of radio wave propagation in the HF range is by
refraction using the ionosphere and by a combination of
reflection and refraction between the ground and the F-layer for
multiple hops. The HF radio propagation window is the range of
frequencies between a Lowest Usable Frequency (LUF) and a maximum
Usable Frequency (MUF). This window varies by location, time of day,
season and with the level of solar and/or geomagnetic activity. Short Wave Fade and Polar Cap Absorption events are types of Sudden Ionospheric Disturbances (SID). In a Short Wave Fade event, intense X-ray radiation emitted during a flare enhance D-layer ionization (thereby elevating the LUF) over the entire sunlit hemisphere of the Earth. In a Polar Cap Absorption event, protons emitted during a flare have a similar effect as they precipitating down through the atmosphere in the polar regions. At times the enhanced absorption may be strong enough to close the HF propagation window completely - this is called a Short Wave Blackout.
Ability to forecast events that cause D-Region Absorption
The ability to forecast D-region absorption events is closely linked to the ability to forecast flares - at the moment this is limited. Flares normally occur in solar active regions and observations of such regions sometimes suggest that a flare could occur, but not when it will occur. However, it is possible to provide a probability that a region will produce a flare of a particular size in the next 12 to 24 hours, especially for regions that have already exhibited enhanced activity. There are rules of thumb for the duration of a flare, given its magnitude, but these fail if the flaring structure is very large - these produce long duration events that can last for many hours.Solar particle events that result in radiation storms are even more difficult to forecast - only a few flares produce this type of event. Observations do suggest that one a regions has produced such an event, it could produce another; also, once an event has started researchers are having some success in calculating the peak intensity and duration. Some radiation storm are caused by the shock fronts moving through the heliosphere, for example resulting from a coronal mass ejection (CME). In these cases it may be possible to determine that a storm is likely before it really starts.
Short Wave Fade (SWF) Event
The plots below shows examples of the operational impact of a Short Wave Fade event on HF radio communication. They are the results of codes produced by NOAA/SEC and IPS that try to predict the extent and intensity of the absorption in an event - (two different events are shown).HAF Prediction produced by NOAA/SEC
 The map in this plot graphically illustrates the
Highest Affected Frequency (HAF) - the frequency that suffers a loss of 1dB during a
vertical propagation from ground, through the ionosphere, and back to ground - as a
function of latitude and longitude. The value of HAF is calculated at the
sub-solar point based on the ambient solar X-ray (1-8 Å) flux using an
empirical formula giving the relationship between X-ray flux and degraded
frequency; the values at other geographic locations are scaled by the solar zenith angle.
The map in this plot graphically illustrates the
Highest Affected Frequency (HAF) - the frequency that suffers a loss of 1dB during a
vertical propagation from ground, through the ionosphere, and back to ground - as a
function of latitude and longitude. The value of HAF is calculated at the
sub-solar point based on the ambient solar X-ray (1-8 Å) flux using an
empirical formula giving the relationship between X-ray flux and degraded
frequency; the values at other geographic locations are scaled by the solar zenith angle. The plot also displays some additional information. The bar graph on the right-hand side of the graphic displays the expected attenuation in decibels as a function of frequency for vertical radio wave propagation. The digital clock near the lower right corner displays the Estimated Recovery Time to normal background conditions, based on an empirical relationship between flare size and duration.
More information on how the plot was produced can be found on the NOAA/SEC site.
ALF Prediction produced by IPS
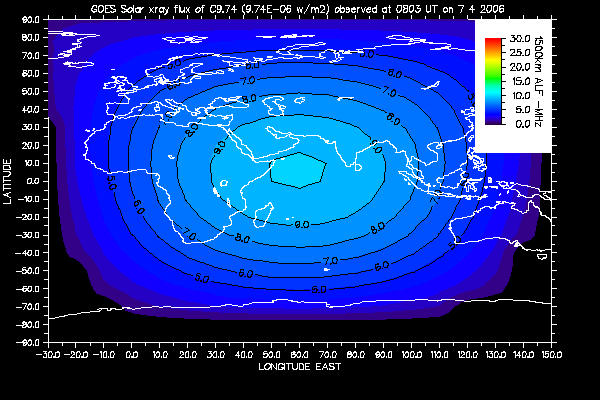 The map shows the Absorption Limited Frequency (ALF) - the lowest frequency
able to propagate for HF circuits typically 1500 km in length
- as a function of latitude and longitude.
Again the value is calculated at the sub-solar point based on the ambient solar X-ray flux and
values at other geographic locations are scaled by the solar zenith angle.
The map shows the Absorption Limited Frequency (ALF) - the lowest frequency
able to propagate for HF circuits typically 1500 km in length
- as a function of latitude and longitude.
Again the value is calculated at the sub-solar point based on the ambient solar X-ray flux and
values at other geographic locations are scaled by the solar zenith angle.
To use the plot, work out the approximate location where your circuit is being reflected by the ionosphere and estimate the value of the ALF from the contours. If the frequency you wish to use is lower than this value then communication is unlikely; if it is higher than the ALF then communication is still possible. For circuits shorter that 1500 km, the ALF values from the map are likely to be too high and communications will still be possible for slightly lower frequencies. For much longer circuits, slightly higher frequencies than the suggested ALF can still be affected by the fadeout.
More information about the plot can be found on the IPS site.
Polar Cap Absorption (PCA) Event
 When very energetic protons (>10 MeV) produced by processes at the sun and
interplanetary space arrive at Earth and enter the atmosphere over the polar
regions, much enhanced ionization is produced at altitudes below 100 km.
Ionization at these low altitudes is particularly effective in absorbing HF
radio signals and can render HF communications impossible throughout the polar
regions.
When very energetic protons (>10 MeV) produced by processes at the sun and
interplanetary space arrive at Earth and enter the atmosphere over the polar
regions, much enhanced ionization is produced at altitudes below 100 km.
Ionization at these low altitudes is particularly effective in absorbing HF
radio signals and can render HF communications impossible throughout the polar
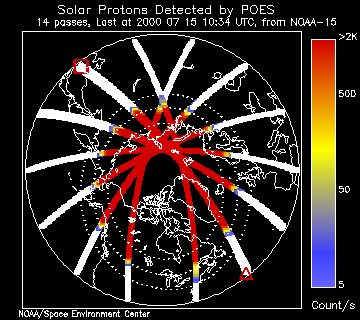
regions. NOAA's Polar Orbiting Environmental Satellites (POES) carry proton detectors similar to GOES. Each POES satellite transits a polar region twice each orbit and can provide a direct measure of the boundaries and extent of the solar proton fluxes entering the atmosphere during an solar particle event (SPE).
There are currently no operational codes for predicting the effect of a PCA event, but the plot of POES data is designed to provide an up-to-date picture of the extent of the Northern polar area being affected during an SPE. This also provides an indication of those HF radio propagation paths that will be badly degraded because of the signal absorption. The beginning of the most recent satellite transit is marked with a red square and its end with a red triangle. Data plotted in white indicates insignificant count rates. The universal time at the start of the pass is given in the caption along with the name of the satellite providing the information.
More information on how the plot was produced can be found on the NOAA/SEC site.
This page is still under development...
Satellite Communications and Navigation
Satellite communication and navigation systems are both affected by conditions in the ionosphere:- The quality of communications can be disrupted if the Total Electron Content (TEC) is too high, or if there is scintillation.
- Position resolution provided by Satellite Navigation systems such as GPS (and Galileo) can be degraded by high TEC (the signal is refracted and the extra path length causing timing errors) and by scintillation (the receiver can loose lock).
- There are additional problems related to satellite based augmentation systems (SBAS) such as WAAS, EGNOS, etc. At mid-latitudes, gradients in TEC can be quite large during geomagnetic storms and the SBAS cannot accommodate them either in accurately measuring the gradients (the spatial density of reference receivers is too small) or in updating the ionospheric correction model (the data rate is inadequate). The problem is aggrevated if reference stations have difficulties contacting sufficent spacecraft when gathering the data needed to calculate the correction matrix.
Ability to forecast Ionospheric Disturbances
The occurrence of scintillation at high latitudes seems to be (mostly) correlated with geomagnetic activity. During geomagnetic storm events, fast TEC changes and ionospheric gradients are frequently observed which may lead to the spatial decorrelation of the ionospheric error calculated for SBAS and other systems.Scintillation at mid and lower latitudes is caused by other mechanisms and is most likely to occur between local sunset and midnight.
Geomagnetic storms manifest themselves as deviations in the Earth's magnetic field from the quiet conditions that extend over wide geographic areas (from high-latitude to mid-latitude and equatorial regions). The disturbances in the geomagnetic fields are caused by fluctuations in the solar wind impinging on the Earth. They may be limited to the polar regions, unless the interplanetary magnetic field (IMF) carried by the solar wind has long periods (several hours or more) of southward component (Bz<0) with large magnitudes (greater than 10-15 nT) - the occurrence of such a period stresses the magnetosphere continuously, causing the magnetic field disturbances to reach the equatorial region. The manifestations of storms are strong deviations in the Earth's magnetic field from the quiet conditions that extend over wide geographic areas: from high-latitude to mid-latitude and equatorial regions.
TEC Map
Several organizations publish maps of the ionospheric Total Electron Content (TEC) - IPS, JPL and RAL. The major difference between the maps is the source of the data used to produce them. IPS uses real time foF2 data from a network of stations to drive the IRI2001 ionospheric model from which TEC is extracted. JPL and RAL use GPS observables from a network of dual frequency GPS receivers with their own mapping algorithms to derive their global TEC maps. While the gross features of GPS derived and data-driven model derived TEC are usually comparable, the absolute level of Vertical TEC at any one point may vary - this is evident in the differences in the three maps. The JPL Map was chosen for these pages because of the currency of the plot.Scintillation Map
The map shows the location of GPS perturbations suspected to be caused by ionospheric scintillation. The scintillation index is plotted for each measurement - this is deduced from high frequency GPS phase fluctuations with empirical normalization. Where scintillation is greatest, GNSS is likely to have position degradation as receivers could loose lock on individual spacecraft. The plot was generated by the SOARS project using data provided by the Ionospheric Scintillation Monitoring Service, (an ESA Space Weather Pilot Project SDA led by CLS, France).The number of stations used to gather the GPS data does not provide complete global coverage - the effect of this can clearly be seen on plot of the whole world. At high latitudes, the area showing greatest scintillation on this plot appears to match that shown on the POES auroral activity extrapolation plots.
This page is still under development...