
Source Properties: Astrometry
Astrometric Correction
As part of SAS processing a linear aspect correction for each
individual image is computed and applied. Detected sources are
compared to the USNO-B1.0 source catalogue and a correction in RA and
Dec is converged upon by source matching. The correction is further
refined after observation images are mosaiced. Fields with too few
sources (N < 4) or offset solutions that yield an rms difference
> 1.0 arcsec between detected sources and USNO matches are rejected
during the screening process. The best-fit offsets for the remainder
are displayed in Figure 1.
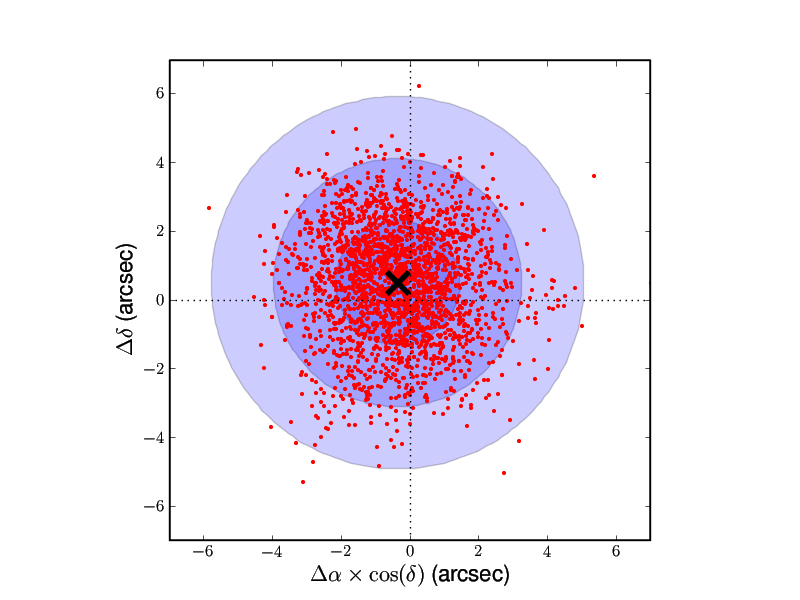 Fig 1: Using source correlations between the XMM-OM and USNO-B1.0
catalogues, systematic corrections are applied to the recorded XMM
pointings and source positions. The above plot summarizes the full
sample of offsets applied in both the RA and Dec directions (red
dots). The black cross is the mean correction and the blue circles
represent 1-, 2- and 3-σ radii from the mean.
Fig 1: Using source correlations between the XMM-OM and USNO-B1.0
catalogues, systematic corrections are applied to the recorded XMM
pointings and source positions. The above plot summarizes the full
sample of offsets applied in both the RA and Dec directions (red
dots). The black cross is the mean correction and the blue circles
represent 1-, 2- and 3-σ radii from the mean.
The directionally-averaged root-mean-square dispersion of the offset distribution is 1.81 arcsec which places a characteristic value on the stability of XMM-Newton pointing. The black cross represents the mean of the plotted sample and it does not occur at the origin, indicative of a systematic offset in spacecraft pointing, <Δαcos(δ)> = −0.36 arcsec and <Δδ> = +0.50 arcsec.
Astrometric Accuracy
Figure 2 provides the distribution of angular offsets between
individual sources and their best USNO matches. The red population are
sources before astrometric correction, the green distribution is the
same sources after the best-fit corrections are applied. The most
common offset after correction is 0.3 arcsec. 50% of detected sources
are within 0.7 arcsec of their counterparts.
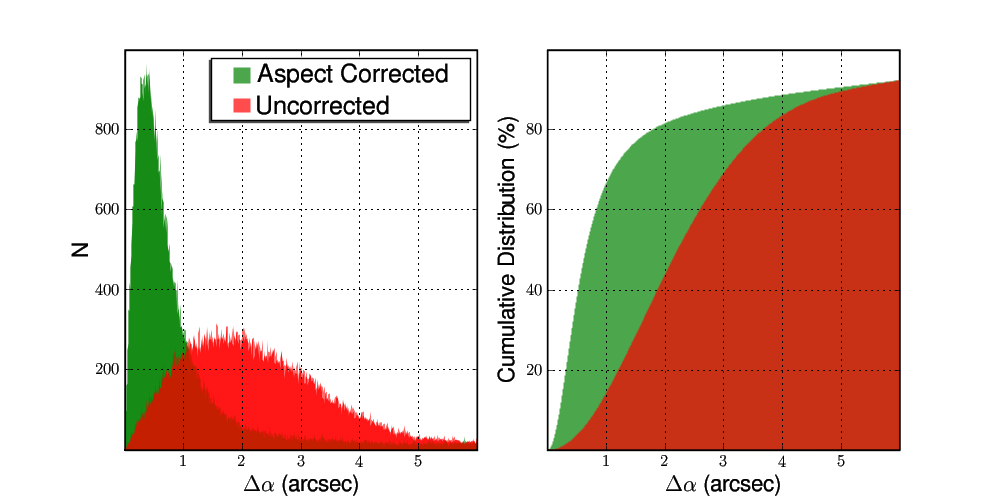 Fig 2: Left: Distribution of angular offsets between all
detected source and their most likely matches in the USNO-B1.0
catalogue before (red) and after (green) the astrometric
correction. Right: The same sources presented as a cumulative
distribution.
Fig 2: Left: Distribution of angular offsets between all
detected source and their most likely matches in the USNO-B1.0
catalogue before (red) and after (green) the astrometric
correction. Right: The same sources presented as a cumulative
distribution.
10% of catalogued sources have no USNO counterpart within a distance 5 arcsec. At separations > 5.5 arcsec the aspect corrected and uncorrected distributions are essentially identical. This is a consequence of the OM sample reaching deeper than USNO-B1.0.