
Source Properties: Sky Coverage
Figure 1 plots the distribution of XMM-OM pointings between the dates 2000 February 3 and 2007 March 31. Only those pointings which contribute sources to the SUSS catalogue are included. The size of the pointing symbols are not related to field-of-view but increase in radius and vary in hue as the detected source density increases, N = unique sources/pointing.
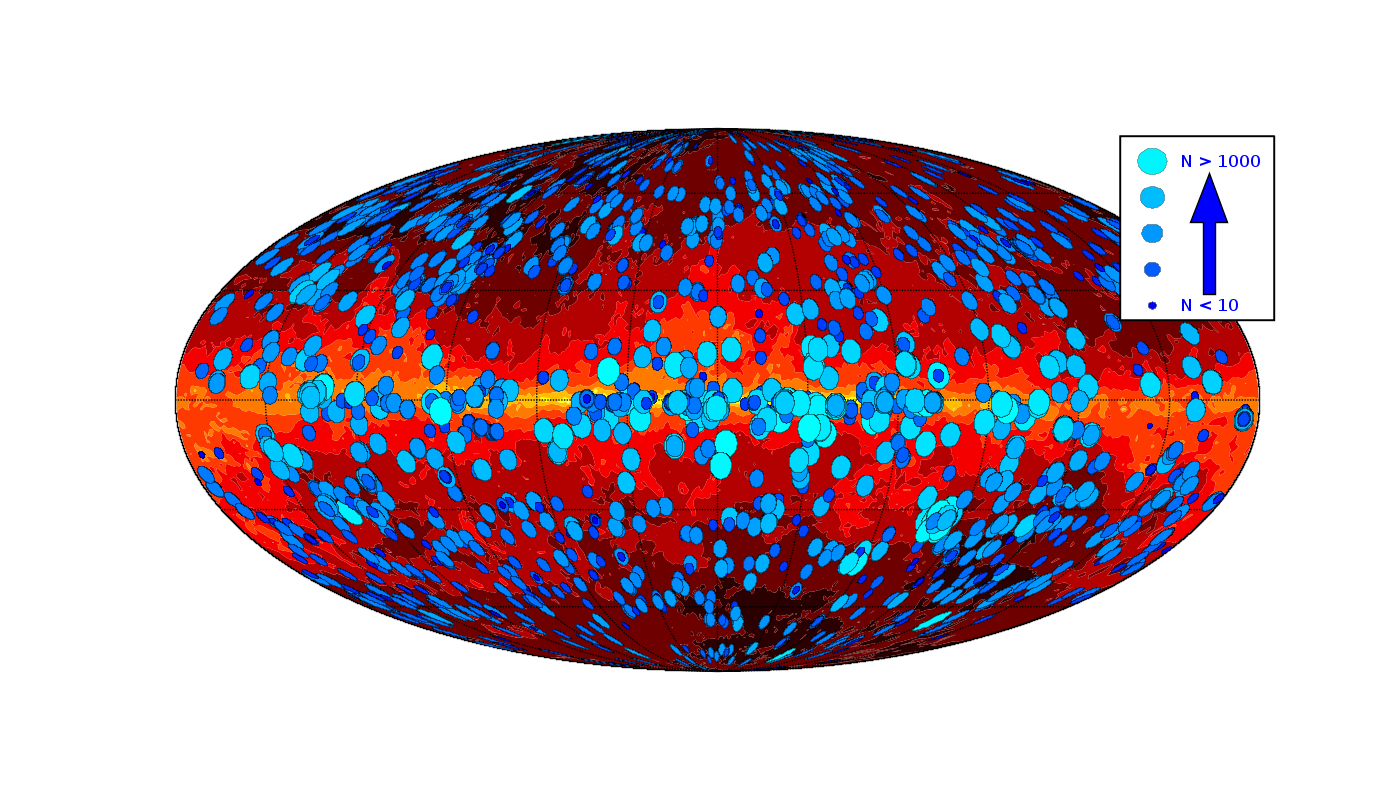
Mirroring the wide variety of scientific experiments performed by XMM for it's Guest Observers, there are sub-clusters of pointings around the Galactic plane, concentrated towards the Galactic center, and the Magellanic Clouds. Between the Galactic plane and poles the pointings have a more random distribution (in a serendipitous sense) for extra-Galactic and Galactic-neighbourhood targets. The FITS file housing the XMM-OM catalogue includes a table extension summarizing pointing-related data.
The following table contains the total area of sky observed through each filter and the fraction of observations, fobs which contain a specific filter. Nsrc is the number of sources found with a detection significance > 3σ.
| Filter | Sky coverage (deg2) | Nsrc (> 3σ) | fobs (%) |
|---|---|---|---|
| UVW2 | 43.7 | 119,805 | 15.9 |
| UVM2 | 29.0 | 145,210 | 19.3 |
| UVW1 | 54.0 | 618,226 | 82.0 |
| U | 21.6 | 177,569 | 23.6 |
| B | 14.3 | 81,191 | 10.8 |
| V | 12.6 | 78,160 | 10.4 |
Table 1: Sky coverage statistics for each of the six XMM-OM lenticular filters included within the catalogue.
Exposure maps for each filters can be downloaded. Since the observations cover a small fraction of total sky, the maps are provided in table form for ease-of-use. The resolution of the maps is 1 x 1 arcmin2; and the maximum exposure time, total exposure time, number of visits and number of observations are provided for each pixel.
Plotting in Figure 2 the distribution of sources as a function of Galactic latitude reveals several clusters, one associated with the Galactic plane at b = 0° and the other at b = 30° associated with the Magellanic Clouds.
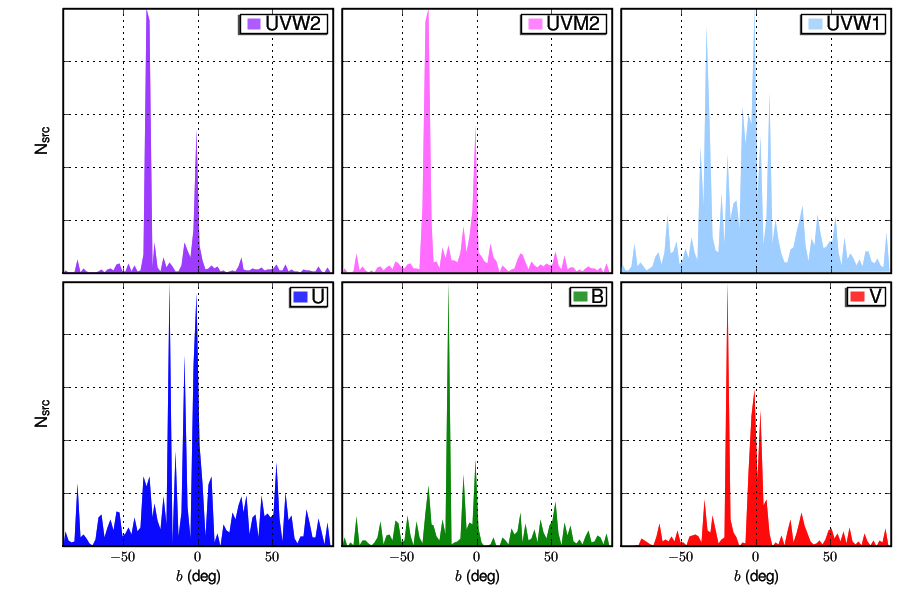
Table 2 provides some statistics for source numbers within ±5° of the Galactic Plane, confined within a cone of radius 4°, centered around the Magellanic Clouds at l = 278°, b = -33°, and at high Galactic latitude |b| > 30°, excluding the Magellanic Cloud cone.
| Filter | NGalactic | NMagellanic | NHigh-b | NTotal |
|---|---|---|---|---|
| UVW2 | 25,097 | 50,158 | 24,439 | 119,805 |
| UVM2 | 25,625 | 53,208 | 35,311 | 145,210 |
| UVW1 | 124,188 | 71,948 | 199,934 | 618,266 |
| U | 34,080 | 4,887 | 74,815 | 177,569 |
| B | 8,738 | 0 | 42,644 | 81,191 |
| V | 27,366 | 0 | 23,073 | 78,160 |
Table 2: Detected source numbers within three sky regions. NGalactic is the number of sources contained within the region −5° < b < +5°. NMagellanic is the number of sources contained within a cone of radius 4° centered on l = 278°, b = −33°. NHigh-b is the number of sources in regions b < -30° or b > +30°, excluding sources inside the Magellanic Cloud cone.
U, B and V sources are under-represented in table 2 because only those optical objects with UV counterparts are included within the catalogue and fields with > 5,000 source detections are rejected in order to avoid crowding confusion during fine-aspect correction. Since the effective area of XMM-OM peaks in the optical, the UBV data contain a larger fraction of crowded fields compared to the UV sample. The optical fields of the Magellanic clouds in particular do not make this cut and don't appear within the catalogue.