Source Properties: Time Sampling
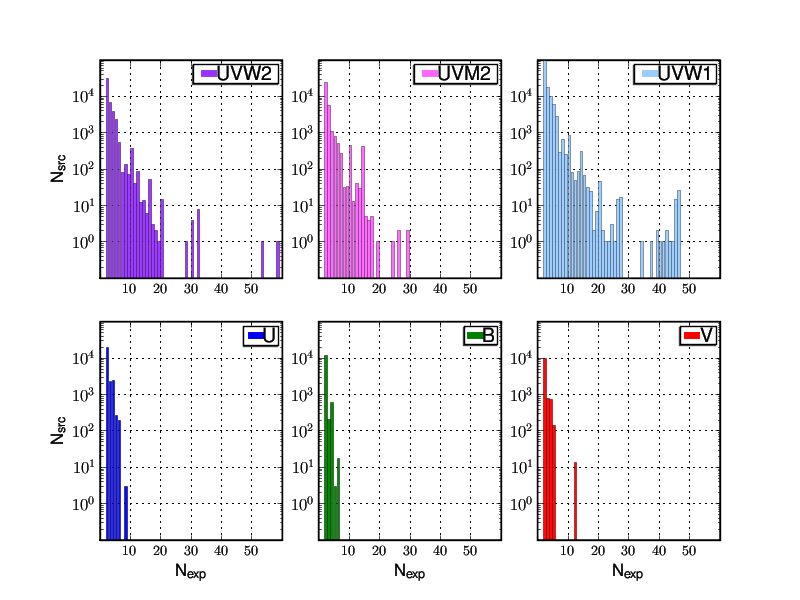
The XMM-OM samples source properties on two distinctive time scales. Multiple exposures through a particular filter are often obtained during one pointing. They provide sampling on timescales between hours and a day. The longest observations are curtailed by radiation constraints at the perigee of the 48 hour spacecraft orbit and individual exposures are limited typically to durations < 5 ksec in order to avoid potential memory corruption after cosmic ray hits. Segregated by filter, figure 1 illustrates the distribution of repeat detections within individual pointings. The differences between UV and optical distributions is a consequence of data selection - only those optical sources with UV counterparts within the catalogue are selected for inclusion.
| Filter | Ne | fe (%) | No | fo (%) |
|---|---|---|---|---|
| UVW2 | 46,031 | 38.4 | 11,657 | 12.0 |
| UVM2 | 33,660 | 23.2 | 13,010 | 11.8 |
| UVW1 | 137,309 | 22.2 | 58,280 | 11.2 |
| U | 24,627 | 13.9 | 18,625 | 12.7 |
| B | 12,732 | 15.7 | 9,702 | 15.4 |
| V | 11,724 | 15.0 | 12,022 | 20.9 |
Table 1: Number of sources detected in multiple images. Ne is the number of sources detected in more than one exposure through a specific filter during a single spacecraft pointing. fe is the fraction of sources detected more than once per pointing. No is the number of sources detected multiple times during different spacecraft pointings. fe is the fraction of unique sources detected during different pointings.
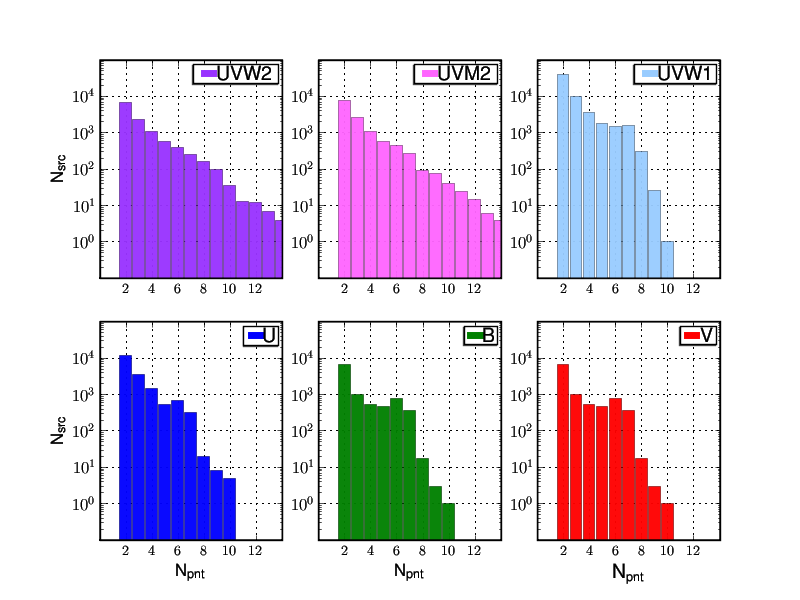
The second timescale for source sampling is of the order years and associated with different pointings to the same field of stars. Figure 2 presents the number of sources Nsrc detected during multiple observations, Npnt is the number of pointings.
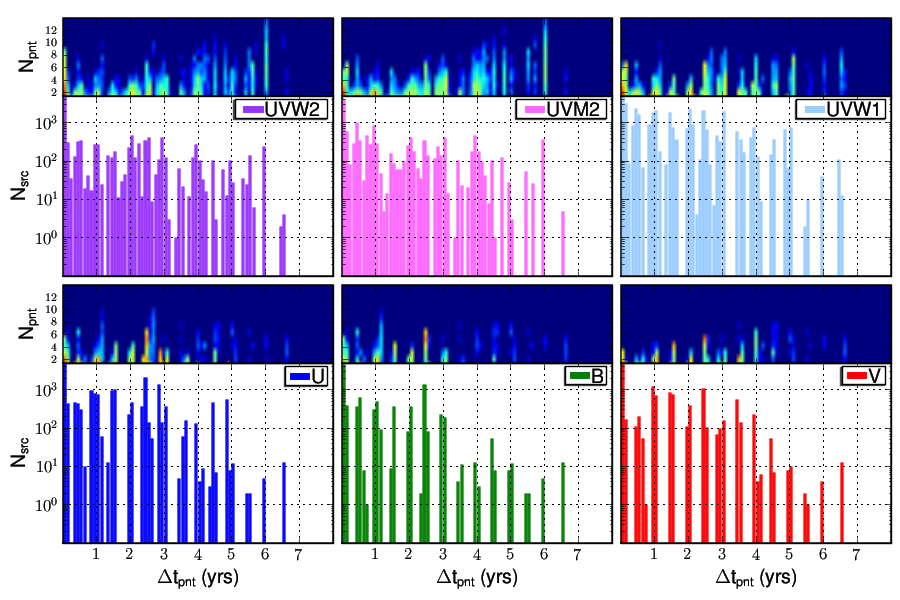
The time domain of detections included in the catalogue span just over 8 years between Feb 24, 2000 and Mar 29, 2007. Figure 3 plots the distribution of time-spans between first and last source detections. The apparent biannual sampling is the result of seasonal pointing constraints imposed by sun angle and efficiency of the solar panel power supply.