CDS/GIS |  |
CDS/GIS | |
Associated Software note is #54, the GIS Instrument Guide.
This page contains information on:
Instrument Overview
SOHO's Coronal Diagnostic Spectrometer (CDS) is made up of 2 spectrometers; one which uses grazing incidence optics (the Grazing Incidence Spectrometer, GIS) and the other which uses normal incidence optics (the Normal Incidence Spectrometer, NIS). The SOHO mission was designed to help answer the following questions:
The GIS contributes to the mission science by determining the characteristics of the coronal plasma, such as temperatures, densities, flow velocities and abundances, through the study of emission lines in the extreme ultraviolet portion of the solar spectrum.
The Grazing incidence spectrometer was born out of the requirement to provide diagnostics in the sub 30 nm region, which is not accessible to the NIS, and is therefore essential to the study of this part of the solar spectrum. GIS works in concert with the NIS, however, they do not observe simultanously. For more information on CDS/NIS please visit the CDS site at the Rutherford Appleton Laboratory.
GIS has 4 detectors placed along the dispersed spectrum which are sensitive to plasmas between 1 x 10^5 K and 3 x 10^6 K and cover the following wavelength ranges:
| 15.1 - 22.1 nm | 25.6 - 34.1 nm |
| 39.3 - 49.2 nm | 65.9 - 78.5 nm |
A single grazing incidence Wolter-Schwartzchild type II telescope and a scan mirror feeds both GIS and NIS.
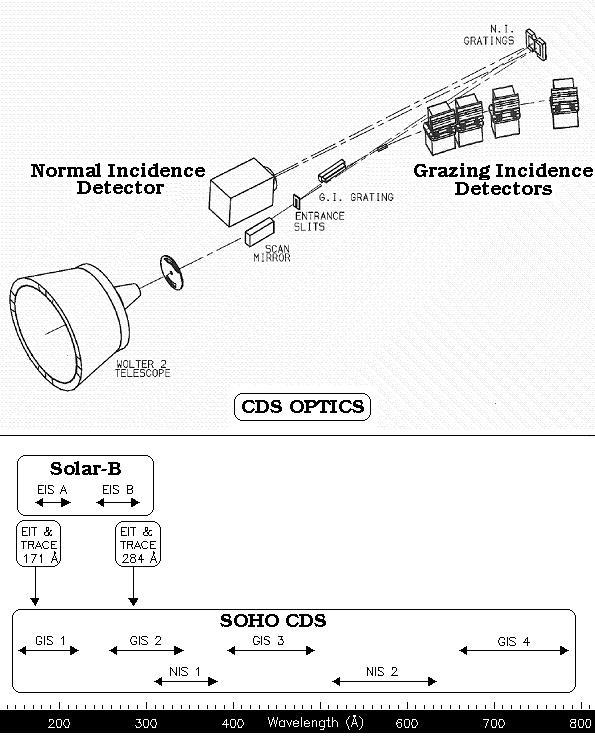
Schematic of the optics of CDS and wavelength ranges covered by GIS, NIS, EIS (onboard Solar-B, launch due August 2006), EIT and Trace.
GIS can be pointed at any location on the Sun, or up to 35 arcminutes from Sun centre. However, to minimise count rate and stray light problems it is advised to keep the pointing within 30 arcminutes from Sun centre (ie. 2 solar radii from centre).
GIS is astigmatic and so does not return spatial information. The only way to obtain spatial information is to raster one of the square aperature slits (2x2 or 4x4 arcseconds) over the desired area.
GIS has the following slits available for use:
Each GIS detector is composed of a stack of 3 microchannel plates (MCPs) which act as photomultipliers. Each MCP stack produces a cloud of electrons which are collected by a position-senstive Spiral readout Anode (SPAN) behind the MCP stack. The position of the initial photon can then be translated into a wavelength.
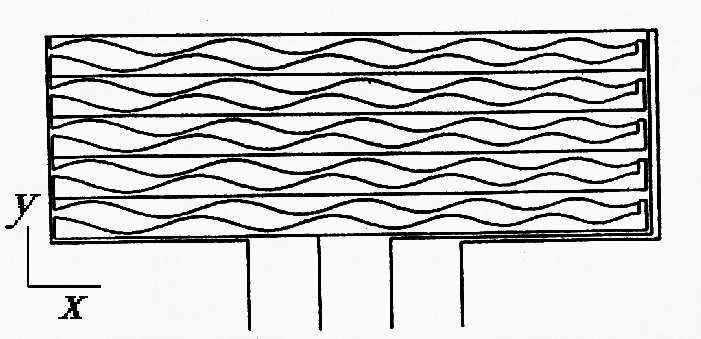
A top-down view of the SPAN. The black lines show the channels which electrically isolate the 3 anodes
The SPAN actually consists of 3 sinusoidal co-planar electrically isolated anodes. The charge falling on the SPAN is divided between the anodes depending on their relative areas.
The SPAN is also divided up, conceptually and in the software, into 2048 'pixels' along the 50mm long x-axis. That means that each pixel is 22mm high and 24.4 microns wide. The charge cloud reaching the SPAN is large enough to be sampled by all three anodes. The relative areas of the 3 anodes along the x direction were calculated before flight, so that they can be decoded into 'pixel' positions via the use of a Look-up Table. So, by measuring the relative magnitudes of the charge collected on each anode, the position of the electron cloud (and so the position of the initial photon) can be determined. At any point along the SPAN (so, in any pixel) the ratio of charge collected by each anode is unique.
There are 5 complete sinusoidal revolutions in the GIS anode pattern. To make the areas of the anodes unique at each point along the x-direction the sine waves are offset by +/- 120 degrees and the amplitude and wavelength of the sine wave varies continuously with position. The charge collected is converted to a digital output using an 8-bit Analogue to Digital Converter (ADC).
When the data (amplitude of charge measured on each of the 3 anodes) are plotted in 3-d cartesian coordinates the values form a spiral. Alternatively the spiral can be plotted using the radius and angle around the spiral (an r-theta plot) for each data point; this gives a series of diagonal strips.
The wavelength of light received varies with distance along the spiral and the width of the spiral is related to noise in the electronics.
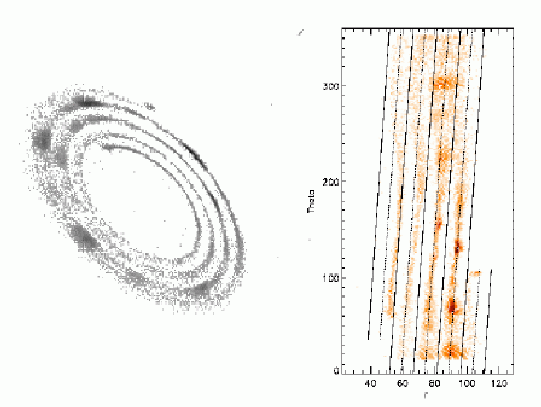
The ADC outputs x and y plotted in a) Cartesian coordinates (left image) and b) r-theta coordinates (right image). Each cycle of the sine wave in the SPAN readout pattern is represented by a turn in the spiral (left image) or an arm (right image). The innermost end of the spiral (left) is equivalent to the bottom of the leftmost strip (right).
A set of parameters, called a look up table (LUT) is produced for each detector. This LUT fits the spiral data and turns the signal from the photon events into an array of 2048 spectral data points as a function of wavelength. A different LUT must be used depending on whether GIS is looking at the quiet or active Sun. This is because the gain in an MCP is sensitive to intensity and the voltage across the MCP must be adjusted to account for this. The specific LUT that is used for an observation along with the voltage is known as the GIS set-up or GSET.
GIS studies
Both GIS and NIS take their observation through a series of studies that are uploaded to CDS on a weekly basis. Each study is a sequence of commands which contains information on:
Many GIS studies exist already and are available for use. To see information on GIS studies click here.
Alternatively new GIS studies can be designed. For this option please contact the CDS project scientist or Principle Investigator.
GIS data
GIS is astigmatic, focussing the image of the slit along the direction of dispersion and not perpendicular to it. In order to obtain images of the Sun the pinhole slit and the scan mirror can be moved so that small regions can be rastered over. The total movement is limited to 4 arcminutes in north and south directions.
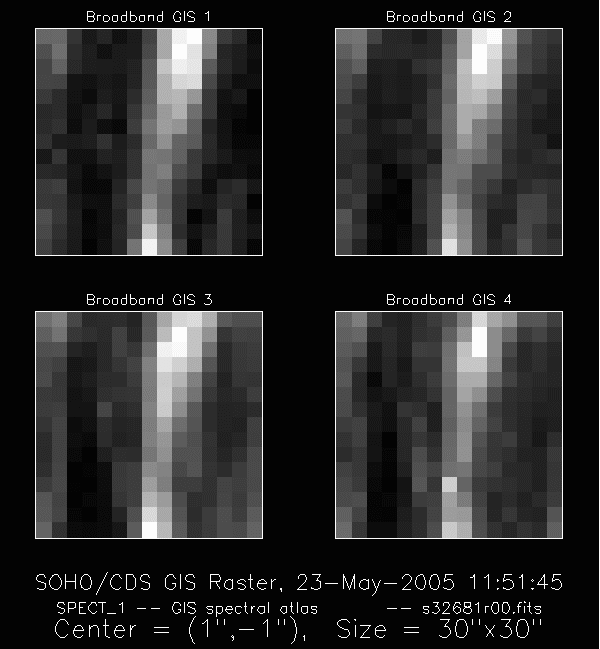
GIS images from the 4 detectors made by using the 2x2 arcsecond slit and 2 arcsec movements in north and south to cover a 30x30 arcsec area.