

Infrared survey is very important for the study of active galactic nuclei. This is because optical or ultraviolet surveys sometimes fail to detect many AGNs, either due to the intrinsic absorption of the optical and ultraviolet flux by the dust cloud surrounding the core nuclei or by the interstellar medium. Infrared surveys can detect the thermal emission from the dust grains. Most normal galaxies emit infrared flux in the range 60 μm -100 μm whereas the flux from AGNs from falls in the range 12 μm -25 μm [21].
WISE and SDSS DR7 Quasar Catalog Matching
In the following section the data from SDSS DR7 (Sloan Digital Sky Survey Data Release 7) Quasar Catalog will be matched against WISE (Wide-Field Infrared Survey Explorer) all-sky data, to identify quasars in the WISE catalog that matches with the SDSS.
In order to do this, the SDSS DR7 quasar catalog was downloaded from the Sloan Digital Sky Survey website in “fits” format. This data now needs to be converted into a format which can be recognized by the website containing the WISE all-sky survey catalog. In order to do this the SDSS quasar catalog was loaded into “Topcat”. Topcat is an interactive tabular data editor and graphical viewer tool. It provides most of the facilities needed for analysis and manipulation of source catalogues and other tables. It understands a number of different astronomically important formats, including “fits” and “votable”. In “Topcat” most of the columns from the quasar catalogue is removed other than the columns defining the co-ordinates of the sources. The catalog is then saved in “fits” format ready to be uploaded, to cross correlate with the WISE database. In order to ensure acceptability, the catalog is then passed through a tool in the WISE website which checks for any compatibility issues and suggests the correction technique. After the final check the data is ready to be matched with the WISE sources. After upload the catalog into the matching tool, an accurate search cone radius has to be mentioned in order to effectively match the WISE sources with its SDSS counterpart avoiding any misdetection or multiple detection of sources.
A few considerations have to be made in order to ensure an effective search cone radius. While matching the SDSS source points with the WISE, according to Lake et al., 2012, there is 1σ 1 axis uncertainty of 0.62” for sources with S/N ∼ 5. Using 1” slit would mean a loss rate of 42% whereas using 2” slit would reduce the loss rate 11%. In order to be completely sure that the counterpart has been matched to the right sources a 3σ source circle is used which translates to about 2.7”. There is also pipeline error, which leads to quasi-random errors in declination in addition to the positional uncertainty. This offsets the positions of the sources in the WISE Preliminary Data Release from their actual positions significantly than their quoted positional uncertainty. About 20% of the sources, which are fainter than 491 μJy, suffer from a pipeline coding error that biases their reported positions by ∼0.2”– 1.0” in the declination direction. Despite these some of the sources with lower signal to noise ratio were as much as 4” away from the closest SDSS source. Therefore in order to match the SDSS DR7 Quasar catalog with the WISE sources properly a core search radius of 4” (arcseconds) needs to be selected [22].
The value is then entered into the multi-object catalog matching tool in the WISE website for counterpart identification. The SDSS DR7 quasar catalog holds about 105,783 sources, which is matched against the WISE all-sky data release, which has approximately 563,921,584 sources. About 47,394 SDSS sources had counterparts in the WISE survey. The new catalog with the WISE counterparts is then saved in “votable” format and loaded into “Topcat”. This catalog is then matched with the initial DR7 quasar catalog to add all the information from SDSS survey, like redshift and the magnitudes from the SDSS optical bands, which were initially removed.
Now a colour-colour diagram will be plotted in the WISE colour space showing where the SDSS DR7 quasar counterparts lie. The plot is made using W1 - W2, which represents magnitude of 3.4 μm – 4.6 μm, in the y axis and W2 - W3, which represents magnitude of 4.6 μm – 12 μm, in the x axis.
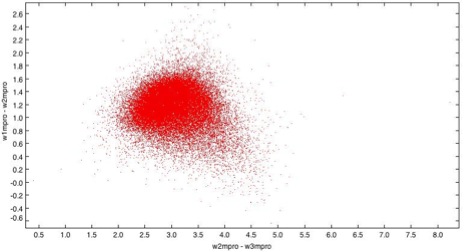
Figure 4.1: (w1-w2) vs (w2-w3) colour plot, showing a counterparts from SDSS DR7 quasar catalog, on the WISE colour space.
Figure 4.2 below shows the colour-colour diagram showing the regions where different classes of WISE detected sources, both extragalactic and galactic falls. This is used as a template to compare where the SDSS counterparts lie in the WISE colour space.
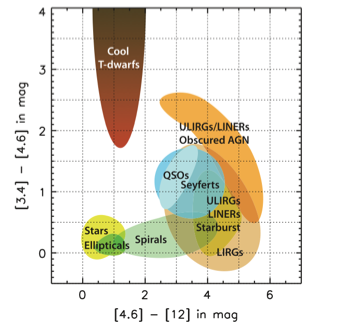
Figure 4.2: WISE Color-space regions where different classes of WISE-detected sources, both Galactic and extragalactic, would fall based on SWIRE templates augmented by GRASIL model [22].
From Figure 4.1 we can see that the main quasar cluster lie with in the region defined by 0.5 < W1 – W2 < 1.8 and 2.25 < W2 – W3 < 4. Comparing this with Figure 4.2 we can see that the sources lie in the QSO and Seyfert region of the WISE space indicated by the blue region, although few sources seems to lie in the ULIRG (Ultra-Luminous Infrared Galaxies) and LIRG (Luminous Infrared Galaxies) region.
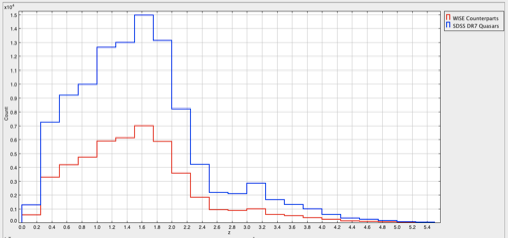
Figure 4.3: Redshift distribution for the WISE matched SDSS DR7 Quasars compared to the whole SDSS DR7 quasar catalog
Figure 4.3 shows the redshift distribution for the WISE matched SDSS DR7 quasars compared to the whole SDSS DR7 quasar catalog. As indicated the blue line represents the standalone SDSS quasar catalog whereas the red line represents the SDSS quasars having WISE counterparts.
In the next part various optical-infrared colour - colour diagrams will be plotted using “Topcat” in order to identify any distinguishable feature, which can be used to separate galaxies with active nuclei from the WISE survey.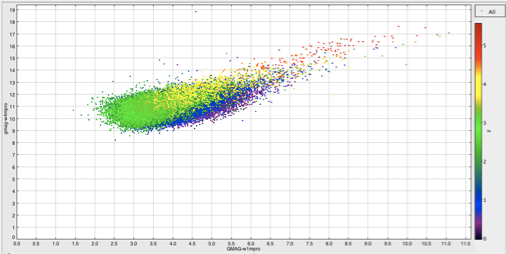
Figure 4.4: WISE matched SDSS DR7 quasar sources in the (g - W4) vs (g - W1) colour Space 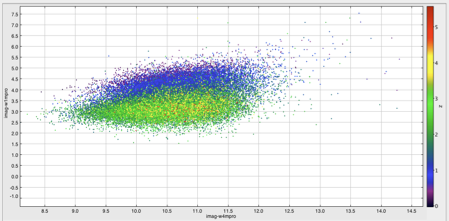
Figure 4.5: WISE matched SDSS DR7 quasar sources in the (i – W1) vs (i – W4) colour Space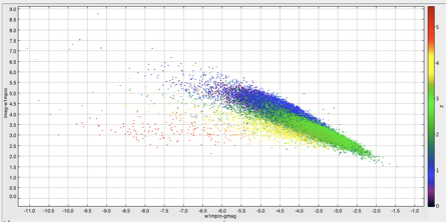
Figure 4.6: WISE matched SDSS DR7 quasar sources in the (i – W1) vs (W1 - g) colour Space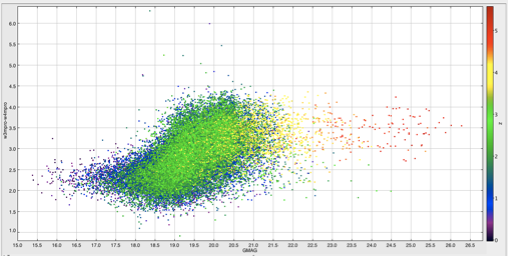
Figure 4.7: WISE matched SDSS DR7 quasar sources in the (W3 – W4) vs (g) colour Space
Figure 4.4, Figure 4.5, Figure 4.6, and Figure 4.7 shows various optical – infrared colour plots of the WISE identified SDSS sources. Although neither of the plots show any prominent feature which can be used to identify “exotic” galaxies, Figure 4.6 shows a clear separation of the sources with different redshifts. Any SDSS sources without available spectra and having counterpart in the WISE catalog can have their redshift broadly estimated. This combined with their location in the WISE colour – colour space can give a fair estimation about the type of astronomical bodies.
WISE and HARD X-Ray Matching
For the next part a catalogue of hard X-Ray, with 62 known sources are used to search for counterparts in the WISE catalog. The same procedure has been carried out as with the previous catalog matching to match these two catalogs and a cone search radius of 10 arcseconds is used to match the WISE infrared catalog with the hard x-ray catalog. A wider search radius has been selected because the hard x-ray sources are taken from the ROSAT survey whose positional accuracy is not very precise. Correlating the two catalogs produced about 51 counterparts. These counterparts are then plotted in the WISE colour space to see if any number of known AGNs lie outside the primary QSO cluster region. As a reference window the SDSS quasars are also plotted on the same plane. Their redshift is also given in the auxiliary axis. The plot is shown in Figure 4.8.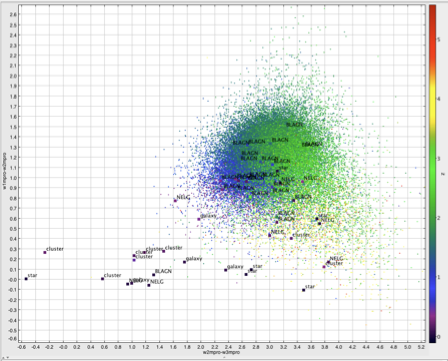
Figure 4.8: ROSAT Hard X-Ray sources plotted on the WISE W1 – W2 vs W2 – W3 colour space
From Figure 4.8 we can see that there is no clustering of AGNs from the hard x-ray catalog outside the central locus, with the exception of one relatively low redshift BLAGN (Broad Line Active Galactic Nuclei).
In this section we take another ROSAT hard X-ray catalog defined in Page, Mittaz & Carrera (2000). The catalog consists of 147 serendipitous X-ray sources selected to have hard spectra from a survey of 188 ROSAT fields [23]. This ROSAT catalogue is then cross-correlated with the WISE survey again with a search radius of 10 arcseconds. This produced about 127 WISE counterparts. This catalogue was then cross-correlated with the previous hard x-ray catalogue to remove the counterparts so that a catalogue with unidentified sources can be formed. This was done by concatenating the 2 catalogues and then performing an internal search to find the matched sources, these matched sources were then discarded to create a catalogue with only the unidentified sources. This produced a catalogue with about 58 unidentified sources. These sources are then plotted on the WISE colour space along with the identified hard x-ray sources in the same plane. This is shown in Figure 4.9
In Figure 4.9 the red dots represents the unidentified sources where as the yellow dots represent the known x-ray sources. These unidentified sources are then cross-correlated with other survey catalogues to find counterparts. This gave a single counterpart in the IRAS (Infrared Astronomical Satellite) survey. This search was performed using a small search radius of 3 arcseconds because the position of the WISE sources are quite precise. The position of this IRAS counterpart is marked in Figure 4.10. It is the red dot inside the black square.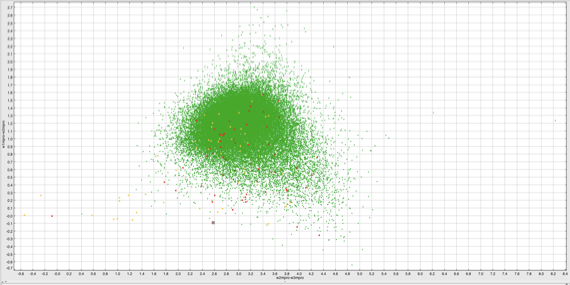
Figure 4.10: Hard x-ray counterpart from the IRAS survey
Further search was carried out with the catalogue of the unidentified hard x-ray sources to find counterparts. Another 6 counterparts were found in the 2MASS (Two Micron All-Sky Survey), including the one found from the IRAS survey. These sources are marked in Figure 4.11. The identified sources are again the red dots inside the black squares.
Figure 4.11: Hard x-ray counterpart from the 2MASS survey