Introduction to the RESIK
detectors
8 March 2004
Main features | Mechanical
construction | Windows and
internal structures
Event position encoding | Computation of Fixed Pattern
Structure
The Coronas-F RESIK instrument uses two
detectors (position sensitive proportional counters) to detect soft X-rays
reflected from the four spectrometer crystals. The detectors are identical to
those used in the Yohkoh
BCS instrument. The detectors were designed and manufactured by MSSL.
Main features
The
BCS/RESIK detector is a proportional counter with a one dimensional position sensitive
readout. It is optimised for detection of X-rays in the 2-7 keV
energy range, and for use in a space environment. It features low mass, small
volume, low power consumption, and long life. Preamplifiers and test circuitry
are mounted in a package on the rear of the detector. No gas supply system is
required, as the detector is sealed permanently.
The gas
filling is an equal Xenon-Argon mixture with 5% CO2 as a quench
agent. The pressure of the gas filling is 1.2 atmospheres at 20 °C. This
mixture of gases was chosen to provide the required quantum efficiency, signal
characteristics and ageing properties.
The
detector requires an external high voltage supply to establish the anode wire
fields. When a photon is detected it emits shaped analog
pulses which require further processing to yield the event positions. The
detector has two anode channels so it can be used to observe two sources
simultaneously.
The
detector is essentially a hollow stainless steel rectangular box, with a thin
(transparent to X-rays) metal foil forming one of the larger faces. Thin metal
wires are suspended along the centre of the box, and high voltage is applied to
these wires (the anodes). Other electrodes (cathodes) in the detector,
including the position readout are held at ground potential. The configuration
of the electrostatic field defined in this way is quite complex, but in the
vicinity of the anodes it is very similar to that of a single-anode, coaxial
cylindrical proportional counter. Near the window, the field lines are more
parallel than coaxial.
The
detector’s basic operation is like any other proportional counter. X-rays
penetrate the window and interact with atoms in the gas. Soft X-rays (1-10 keV) can travel a few mm in the gas on average before being
absorbed. Each absorbed photon ionises a few hundred gas atoms on average, the
number being approximately proportional to the energy of the photon. These
“primary” electrons drift toward the anodes under the influence of their
electric field. The field strength increases as the electrons get closer to the
wire, and so the energy of the electrons increases. Eventually the energy of
the electrons is sufficient to cause further ionisation, and the resulting
electrons quickly acquire enough energy to cause ionisations themselves. This
multiplication process (the avalanche) produces enough charge for a signal to
be detected on the anode wire.
This type
of detector is called a proportional counter because the total quantity of
charge in each avalanche is, on average, proportional to the photon energy,
although the size of the avalanches is subject to random fluctuations. A charge
sensitive preamplifier is connected to the anode and the number and approximate
energy of incident photons can be determined.
The
position sensing capability of the detector is accomplished by the Backgammon
technique (so called because configuration of the readout cathode, interleaved
wedges, resembles a Backgammon game board, or Jeu de Jacquet).
When an avalanche occurs at the anode, charges are also induced on the readout
– the amount of charge on each of the two electrodes depends on the position of
the event – and these induced signals are used to determine the position, in
one dimension, of the event.
See below for further details
on the encoding system.
Mechanical construction
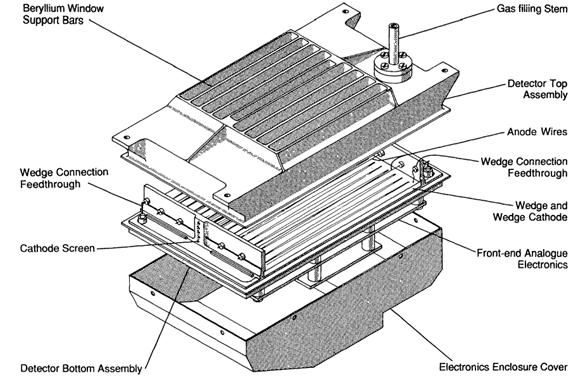
An overall view of the detector package is
shown above.
The
detector is mounted in the spectrometer by means of attachment points on the upper
(window) side. In its flight configuration, an electronics package is
integrated with the detector, and this package has an alloy enclosure and cable
harnesses. A multi-wire harness terminated in a 25 way D type connector carries
all power and signals except for the anode high voltage, which is fed via a
separate cable terminated in a Reynolds screw connector.
It is
permanently sealed by means of a weld around the seam where the base joins the
window frame. Of these two subassemblies, the base is the more complex. It
comprises: the electrical feedthroughs; mounting
arrangements for the anode and cathode wires; and slots to hold the cathode
readout plate in position. The base forms one face of the box that makes up the
detector.
The window
frame forms the other five sides of the box, with the window foil itself making
up most of the face opposite the base. The window frame has a recess into which
the window is bonded, and an attachment point for the gas filling tube. The
four detector mounting points are also part of the window frame.
The
detector is fixed to the spectrometer by means of four “feet”, which are part
of the window assembly. A vibration-damping mounting system is used, consisting
of small o-rings and continuity straps. This isolates the detector from
vibrations and the structure (at launch and at other times during assembly and
integration) whilst preserving alignment and maintaining electrical continuity.

This photo shows a detector mounted in the
RESIK spectrometer.
Windows and internal structures
X-rays
enter the detector through its window, which is a single piece of 125 mm Beryllium foil brazed to the
window frame. Although the window is securely attached to the window frame, the
strength of the Beryllium foil is insufficient to support the outward pressure,
and therefore the window frame has a number of apertures cut into it, leaving
bars arranged along the length of the detector. These are stiff enough, and
closely enough spaced, to fully support the window. These bars reduce the
active area of the detector. Because they are parallel to the position sensing
axis of the system, the presence of these bars has no other effects in the
spectra.
There are
seven electrical feedthroughs at the rear of the
detector. Each pair of anodes has a feedthrough,
shown on the right hand side of the sectional view in drawing A1-5219-308. The
two parts of the readout cathode are connected to feedthroughs
located at opposite corners of the base. There are three “stim”
connections, approximately equally-spaced along the centre line but offset to
allow for the strengthening members positioned along the centres of both axes.
The anodes
are connected together in pairs, by conductors (inside the detector, but
outside of the internal end walls). The anodes are 15 mm diameter (0.6 thou’)
alloy wires (92 % Pt; 8 % W).
Reproduce
this figure: c:\user\matt\thesis\xsect.cdr
Figure 2.
Cross-section through the detector showing the relative positions
of the anodes and cathodes.
There are
four anode wires, nine cathode wires, and other cathode surfaces.
The
detector volume is divided into two cells by a set of cathode wires. These
wires are equally spaced along a line which divides the cross-section of the
detector into two equal parts. The figure shows the arrangement of these nine
wires, which are 25 mm in diameter.
The effect
of these cathodes on the electric field is the same as if a solid conductor
were to divide the detector. The potential is zero at the cathodes, and so the
field configuration is symmetrical. The counter thus functions as two separate
detectors.
The
position sensing function of the detector is provided by the wedge and wedge
cathode plate. This is a fused silica (quartz) plate, 2 mm thick, with a thin
gold layer deposited onto it. A continuous line is etched into the conducting
layer, dividing it into two electrodes (the wedges). When the detector is
operated, a charge distribution is induced onto this cathode whenever there is
an avalanche on the nearby anode wires. The wedges act to divide the quantity
of induced charge according to the position of the avalanche. The signals from
the wedges are processed to determine the position of each event.
Three
circular metal pads have been deposited on the rear of the read-out plate. The
function of the pads is to provide a means of testing the wedge electronics
without having to apply high voltage to the unit. It also allows for
rudimentary calibration of the position-encoding system. A stim
pulse (tail pulse) is switched between each of the stim
pads in turn (this is handled by the FEE package), with either anode
preamplifier also stimmed with an inverted pulse. An
externally generated stim clock controls the
switching.
The voltage
pulse on the pads induces a signal on the wedges (there is a capacitive
coupling with the wedge electrodes). Because the pads are large enough to cover
a few pitches of the readout, the size of the induced signals on the two
electrodes depends on the position in much the same way does the signal from an
avalanche (photon event) on the anode wire. When processed by the position
decoding system, three peaks are seen in the position data, corresponding to
the position of the pads.
Event position encoding
The
positioning encoding system establishes a bin allocation for detector photon
event based on its physical location. An avalanche arriving at the anode wire
at a particular location causes induced charges to appear on the wedge
electrodes. This is picked up as event signals in channels A and B which are
digitised by the (8-bit) ADC's. The ADC data is then routed through the look-up
table (LUT) to produce the encoded position datum.
In the Yohkoh BCS, position processing occurs in the unit “BCS-E”.
In RESIK, the spectrometer electronics unit carried out this function, using
identical circuit designs (although the LUT contents differed).
Implementation
of the function in a fixed look at table, where the result is determined solely
by memory content at an address determined by the values of the operands, is
advantageous in space-engineering terms. At the time of the design of this
encoding circuit for Yohkoh BCS, it was the only
practical route given the prevailing performance, engineering and cost
constraints.
However,
this method of encoding positions does have some drawbacks. Mainly these are
related to the degree of uniformity seen in the encoded data. At certain
positions, it appears as if there are spikes and notches in what should
otherwise be a flat or smoothly varying pattern of illumination. This is most
pronounced at the centre of the readout, and is clearly visible at
approximately one quarter and three quarters of the distance along it, and also
results in less pronounced nonuniformities elsewhere.
These are
seen both in the RESIK data and formerly in the BCS data (the Yohkoh Analysis Guide makes reference
to these effects).
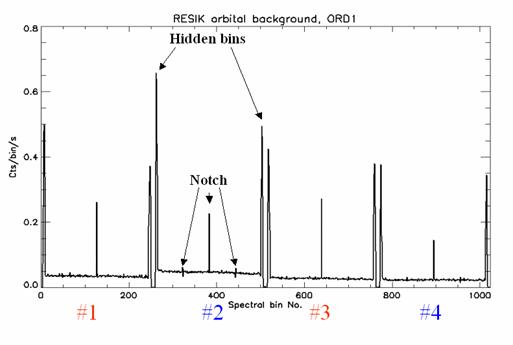
The main
“Notches” are easily seen in the data set below, which is a night-time exposure
with no filtering or post-processing. The energy deposited in the detector is
due to orbital background counts, whose spatial distribution is uniform over
the detector.
These nonuniformities are due to the way in which ADC output data
is processed by the instrument position-encoding lookup table. This is because
the lookup table implements a digital division operation at a fixed arithmetic
precision. The attributes that are seen are not present if the same operation
is carried out in floating point arithmetic (or indeed at suitably higher
integer precision).
The
BCS/RESIK lookup table stores, essentially, the result of the following
expression in the lookup table address (A, B):
256 . A / (A+B)
If the
result is not exact, then the nearest integer value is used.
The nature
of the resulting transfer function, from real position to encoded position, is
not smoothly varying. The most important determining parameter, apart from the
position of the event, is the total pulse height (A+B). At small values of
pulse height the adjacent values in the look at table may differ by values
greater than one. Here the encoded precision is less than the optimum. At
larger values of pulse height, adjacent entries in the lookup table may be
identical. Along a particular locus, where the pulse height is exactly 256, the
encoded position changes by exactly one at each available address location.
This locus is the main diagonal from (0, 255) to (255, 0) on the map of the lookup
table represented in the figure below.
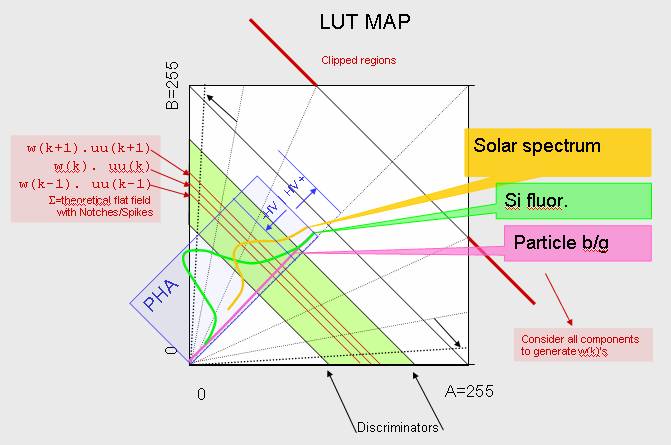
When we
consider this map, representing the grid of available ADC coordinate pairs, we
can appreciate the origin of the “notches”. It resembles the optical effect
seen when driving near a field of regularly spaced plants, military gravestones
or other objects (e.g. this installation).
Along certain directions of view, clear corridors seem to open up. In other
directions we perceive an unbroken mass of objects. The angles along which we
see a lower apparent density of objects are those where there is close
alignment of our view angle and the symmetry of the grid. These are analogous
to the locations of spikes and notches in the spectrum data.
The effect
has been called The Spike or The Notch, but more properly it should be called
Fixed Pattern Structure or Flat Field Structure since the effect can influence
any bin in the data and not only the main “directions” along the LUT map. It
should be noted that the structure seen will depend on the locations being
sampled by the ADC-data, and is hence data-dependant. Technically it is not a
true Fixed Pattern, and cannot truly be removed by scaling by a constant flat
field. However, for practical comparison of spectra, a convenient approximation
can be made to such a scaling. This is possible since the appearance of the
structure is relatively stable over a range of similar observations. In order
to apply this scaling in an analytical context (i.e. quantitative analysis of
spectrum line properties), the uncertainties inherent in the detector data and
any correction methods should be considered.
Computation of Fixed Pattern Structure
A
simulation technique has been followed successfully to reproduce the fixed
pattern details. This work was done by Phillips (MSSL, 199?) and Sylwester (SRC, 2004), respectively, for the Yohkoh BCS and RESIK instrumentation setups. This section
outlines the general approach.
The centre
point of the main diagonal (and all other diagonals parallel to it) corresponds
to detector events occurring at the midpoint of the position readout. The
distance of the event from the origin (bottom left) in this map, corresponds to
the event of pulse height (A+B).
Since the
detector's pulse height distribution (seen as the instrument PHA data) is broad
(about 20% for the typical RESIK photon energy), then at any given position on
the detector, a certain length of particular radial spoke in the lookup table
map will be involved in encoding the position of the events. The frequency of
sampling a LUT coordinate is determined by a weight given by the pulse height
distribution.
Note that
in both the BCS and in RESIK a single channel discriminator is applied to the
event of pulse height before acceptance of the event data into the encoding
stream. Therefore a limited swathe (or stripe) of the table will be used in any
observational setting, determined by the upper-level and lower-level
discriminator settings.
A
theoretical “flat field” for a given set of experimental conditions can be
generated from the following inputs:
- discriminator settings
- detector HV
- pulse height distribution,
including any fluorescence
- relationship between ADC
values, discriminator setting and PHA scale
- LUT scaling parameter
(compression of occulted bins)
The
resulting function can be used to invert the observed data to mask the effect,
by scaling, of the division non-uniformities. It should be noted that there are
uncertainties involved in the determination of all the above parameters, and in
the encoding process itself, and that any such inversion will introduce a
finite additional uncertainty into the processed data.
It should
also be noted that the mechanism of the effect is not a scaling law (like a
sensitivity change) but a redistribution of counts from one location,
inaccessible due to the finite table, to another. In general no counts are lost
due to the encoding process, and any re-scaling function should maintain this
property.