
Flux calibration visual grism: clocked mode
General Remarks
The visual grism is about 50% more sensitive than the uv-grism, and sensitive to the range of 2650-6000A, with a good response in the range 2870-4770A. Second order contamination occurs above 4900A, depending on the blue-ness of the spectrum, and also its brightness, as a large coincidence-loss tends to pronounce the effect of the second order on the spectrum. Unlike the uv-grism, the spectra are not curved on the detector, and overlap. The calibration spectra were taken for the central part of the detector, up to about 3’ from the default position. The current calibration supplements them with the flux variation over the detector as predicted by the optical Zemax model.
The clocked mode implies a rotation of the aperture over the field of view. As a result the left hand part of the detector is not illuminated which results in reduced response. The available calibration spectra do not cover that part of the detector, but the effect can roughly be corrected for using the model.
The initial version of the new flux calibration is making use of all available spectra, even those with large coincidence loss. This approach is different from that used in the uv grism, but a revision will be made in the future based on including fainter spectra and a better formulation of the coincidence loss.
Since the part of the error depends in part on the size of the coi-correction, a slow variation along the spectrum of the flux error occurs. This is in addition to the error due to poisson noise.
Calibration Sources
The flux calibration relies on a number of sources, mostly White Dwarfs, which were flux calibrated, mostly for HST instruments. They have been supplemented by a F0 V spectrum. The calibration spectra were taken during the mission, starting in march 2005. The table list them in a rough order of brightness.
| Name | RA(J2000) | DEC(J2000) |
|---|---|---|
| WD1121+145 | 171.0632042 | 14.2295889 |
| BPM16274 | 12.5151542 | -52.1376333 |
| WD1057+719 | 165.1426000 | 71.6341639 |
| LTT9491 | 349.8965125 | -17.0918444 |
| GSPC P177-D | 239.8065542 | 47.6116139 |
| GD50 | 57.2085042 | -0.9744806 |
| GD108 | 150.1968583 | -7.5585583 |
The following figure shows the spectra taken from reference sources.
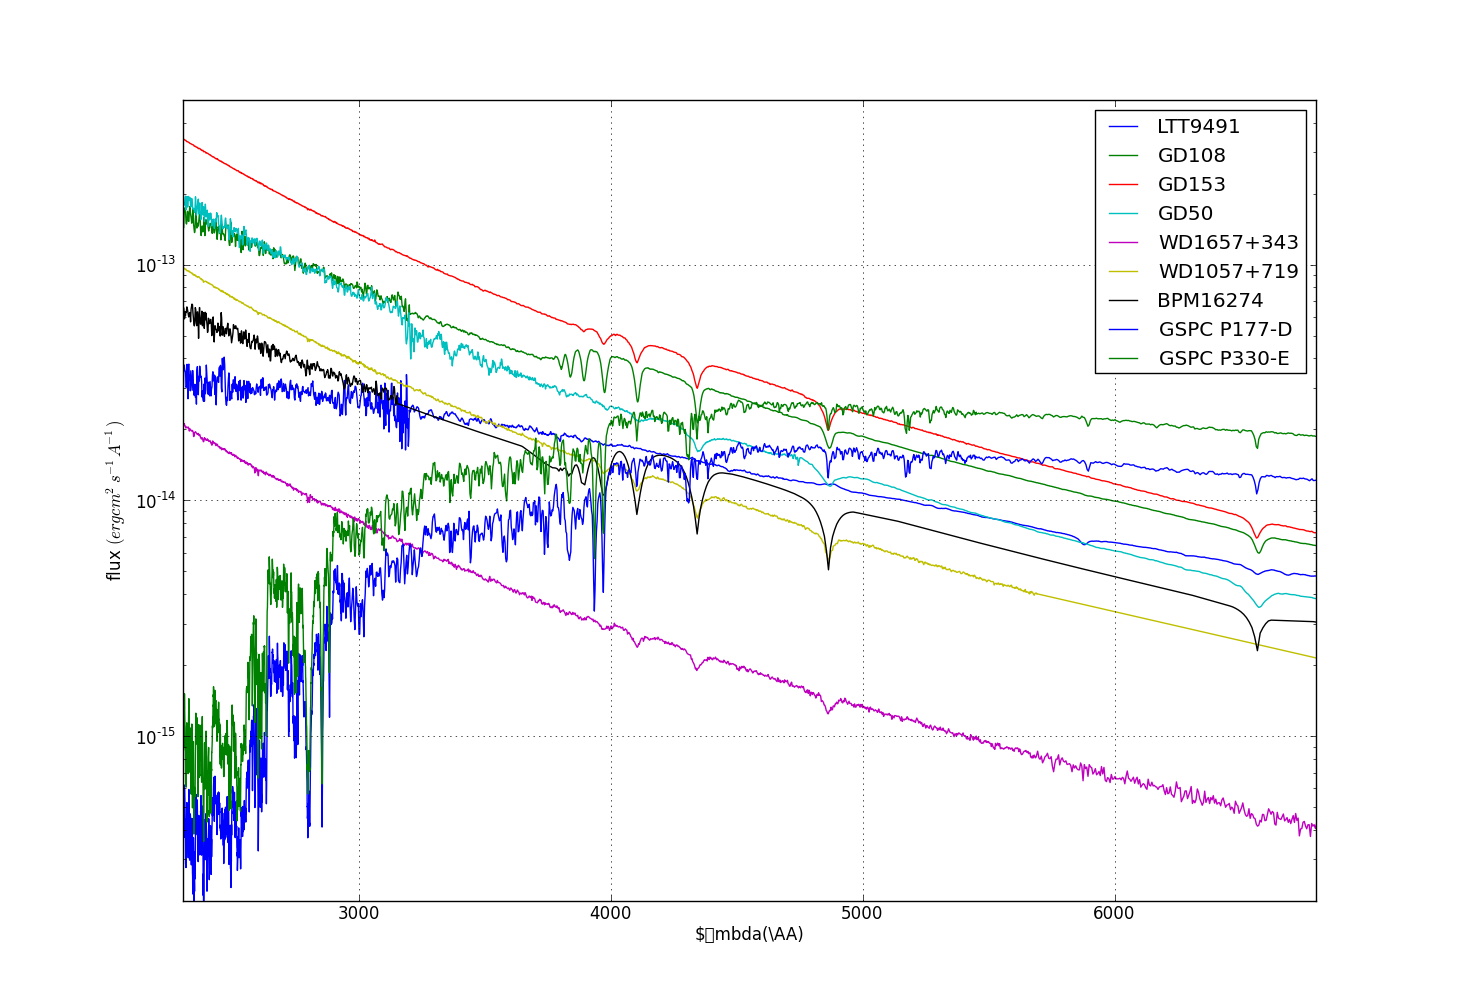
All reference calibration spectra are shown, except for WD1121+145.
WD1121+145 has about the same flux as WD1657+343 shown here.
Coincidence-loss
A lower flux means less coincidence loss. In order to show the level of coincidence-loss, a figure has been made for the visual grism observations near the default location on the detector.
Typical values of the coincidence loss can be seen in Coincidence-loss as a function of brightness .
Caution:
The current coi-correction method is based on an ad-hoc assumption and
fit to the uv-grism data. A theoretical approach has been developed to
get a better correction, but that has not yet been implemented for this
calibration. As a result the effective area from very weak spectra and from
much stronger spectra are not completely aligned.
At this point, the coi-correction accuracy is larger than other sources of error in the determination of the effective area.
Effective Areas
As discussed in Effective Areas the coincidence-loss correction leaves some error in the determination of effective areas of 10%. This is expected to be similar in both nominal in clocked mode.
For wavelengths over 4900A, the second order causes deviations. The figure below shows the mean effective area at the default location (detector coordinates [1140.7,1029.6] for the visual grism: clocked mode) with a shaded error region. Calibration targets observed at the default position are BPM16274, WD1057+719,LTT9491,GD50, GD108. That means the faintest spectra included have a coincidence loss factor of about 1.16, but that a coi-factor of 1.35 is more typical. As in the nominal mode, a 10% error in the flux accomodates the current uncertainty in the coi-correction.
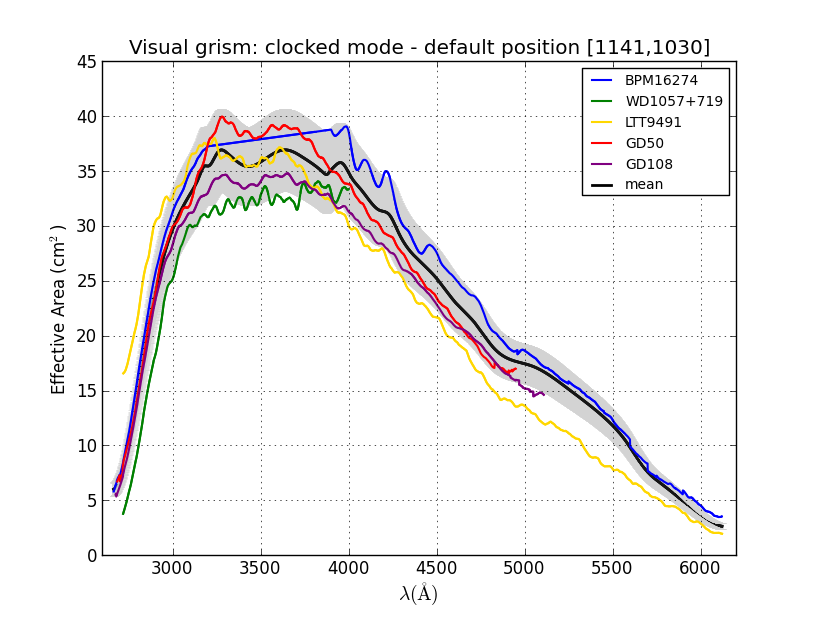
The effective area derived for the default position is shown in yellow with a grey shaded band for the error. The fainter sources have the larger effective area.
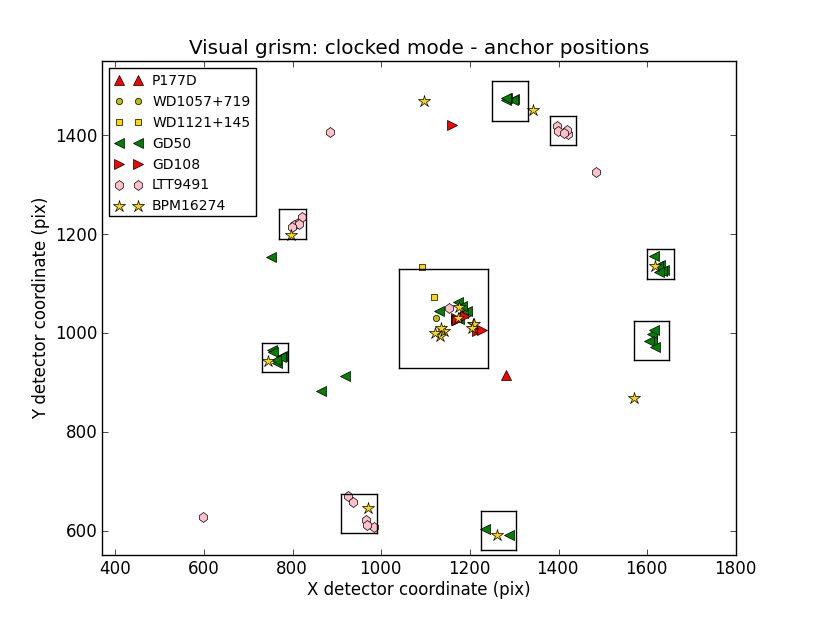
The effective area were derived for the default position in the middle and at various locations, mostly about 3 arcmin away, as indicated by the boxed areas.
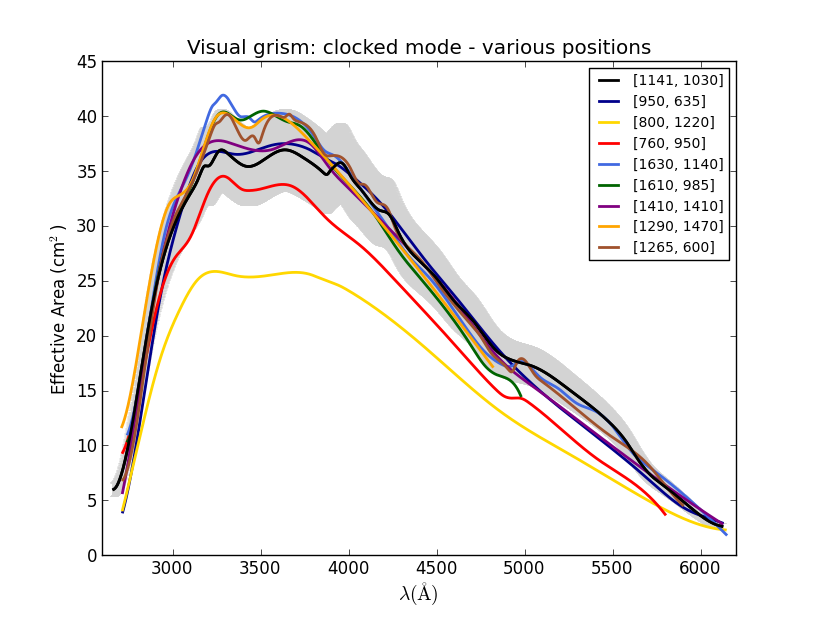
Effective areas at different locations are shown as well. These selected regions are shown by their centre locations in the legend.
The effective area were derived for the default position in the middle and at various locations, mostly about 3 arcmin away, as indicated by the boxed areas.
The effective area is less in the left hand side of the detector, and more so in the top half due to the clocking of the filter wheel covering part of the aperture. This is readily seen in the yellow curve [800,1220] being very low, and also in the red [760,960] curve. In order to deal with this decrease in response, the measured positions will be extrapolated using the Zemax model after renormalising to the measured effective area. The highest effective area is typically for spectra positioned at the top right hand side of the detector.
Note:
It is to be expected that the final coincidence-loss correction
will change the associated coi-corrected effective area closer
to that of the faint sources.
A new calibration file incorporating the effective areas at the different offsets has been made.
Performance of the new flux calibration
A consistency check of the calibration is obtained from using the new calibration file with the calibration spectra as shown below.
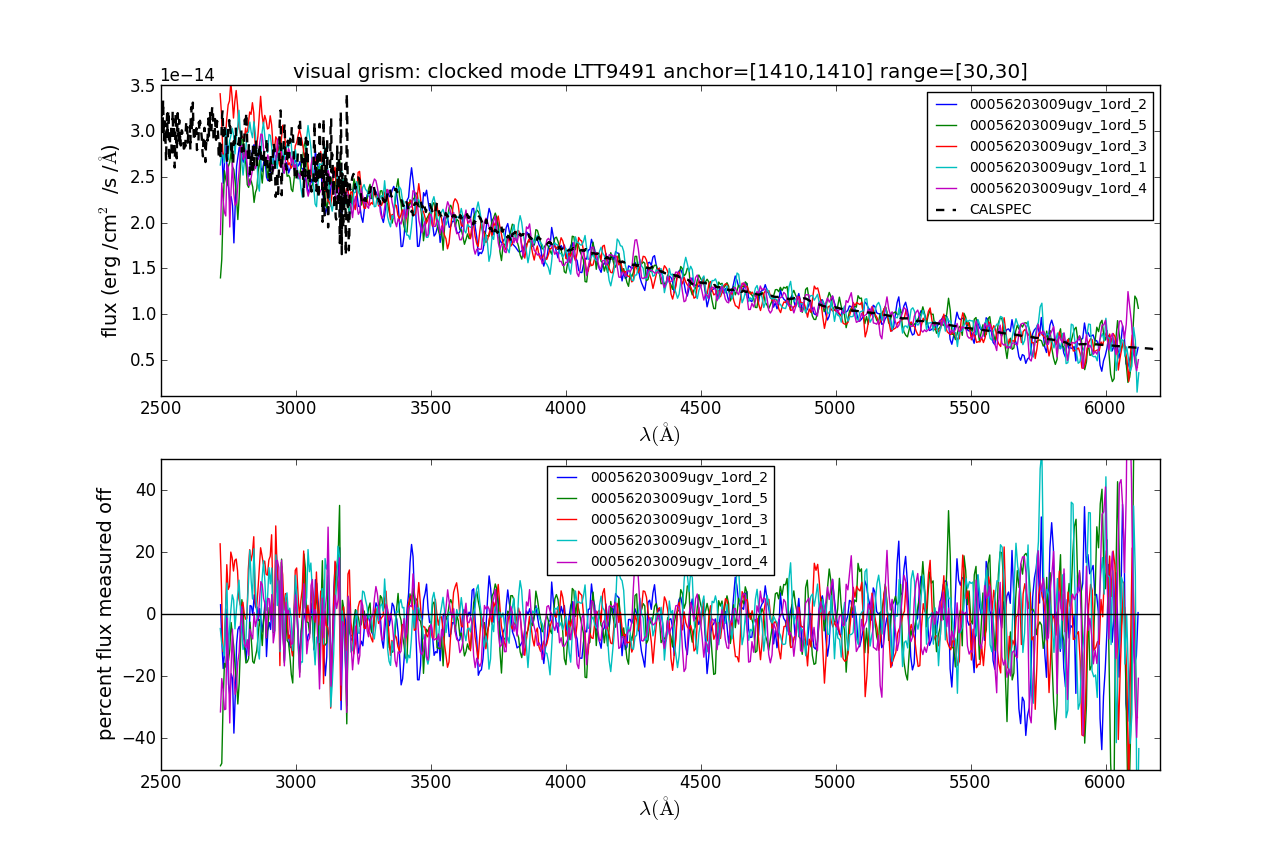
The uvot spectrum of LTT9491 compared to the reference spectrum. This spectrum is at the top right hand part of the detector.
Notice that the flux is in the good range. The fit is good.
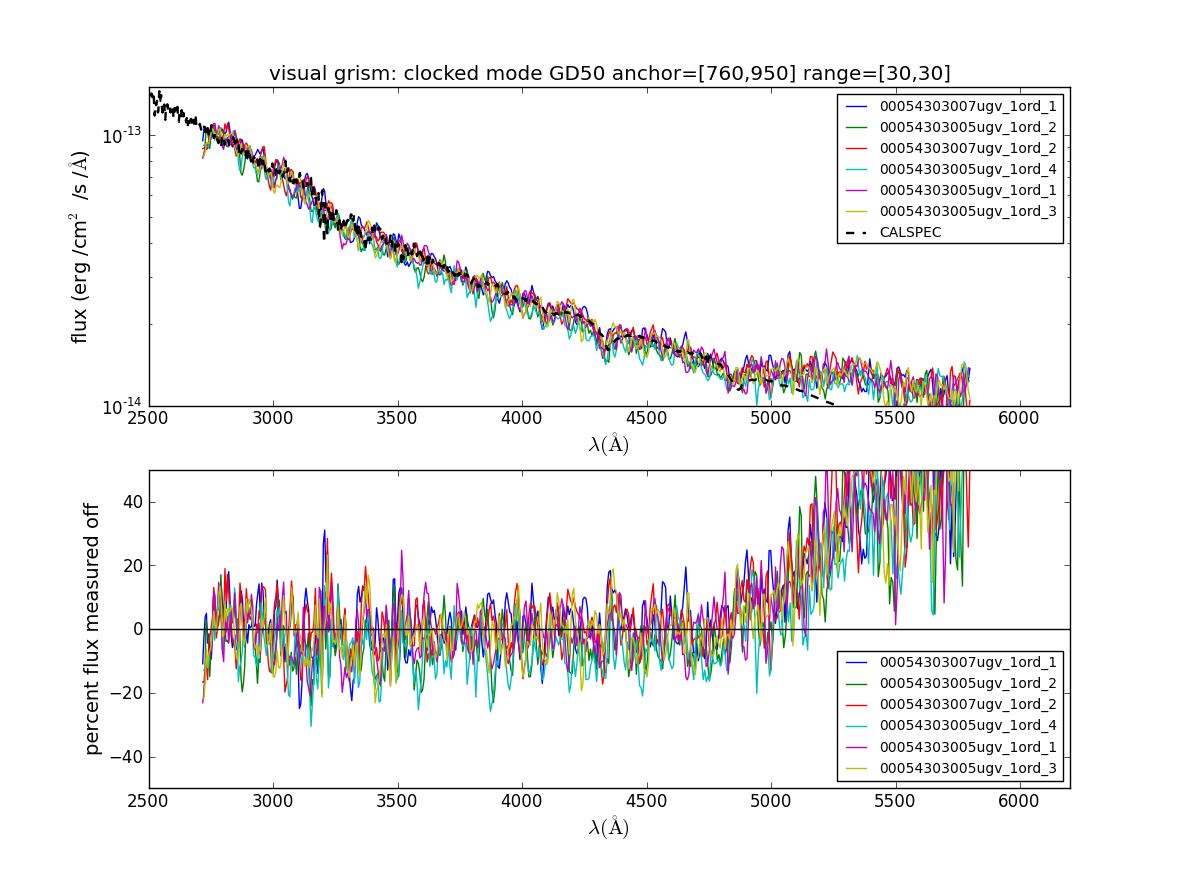
The uvot spectra from GD50 compared to the reference spectra at a location to the left of the default position.
This somewhat brighter source has also a very good fit. Notice that above 4900A the flux in the uvot spectrum is too high due to the additional flux from the second order. The performance of the calibration is discussed further at Verification of the flux calibration in the visual grism: clocked mode.