
Flux calibration visual grism: nominal mode
General Remarks
The visual grism is about 50% more sensitive than the uv-grism, and sensitive to the range of 2650-6000A, with a good response in the range 2870-4770A. Second order contamination occurs above 4900A, depending on the blue-ness of the spectrum, and also its brightness, as a large coincidence-loss tends to pronounce the effect of the second order on the spectrum. Unlike the uv-grism, the spectra are not curved on the detector, and overlap. The calibration spectra were taken for the central part of the detector, up to about 3’ from the default position. The current calibration supplements them with the flux variation over the detector as predicted by the optical Zemax model.
The initial version of the new flux calibration is making use of all available spectra, even those with large coincidence loss. This approach is different from that used in the uv grism, but a revision will be made in the future based on including fainter spectra and a better formulation of the coincidence loss.
Since the part of the error depends in part on the size of the coi-correction, a slow variation along the spectrum of the flux error occurs. This is in addition to the error due to poisson noise.
Calibration Sources
The flux calibration relies on a number of sources, mostly White Dwarfs, which were flux calibrated, mostly for HST instruments. They have been supplemented by a F0 V spectrum. The calibration spectra were taken starting in march 2005. The table list them in a rough order of brightness.
| Name | RA(J2000) | DEC(J2000) |
|---|---|---|
| WD1121+145 | 171.0632042 | 14.2295889 |
| WD1657+343 | 254.7129625 | 34.3148667 |
| BPM16274 | 12.5151542 | -52.1376333 |
| WD1057+719 | 165.1426000 | 71.6341639 |
| LTT9491 | 349.8965125 | -17.0918444 |
| GSPC P177-D | 239.8065542 | 47.6116139 |
| GD50 | 57.2085042 | -0.9744806 |
| GD108 | 150.1968583 | -7.5585583 |
| GD153 | 194.2597125 | 22.0313667 |
The following figure shows the spectra taken from reference sources.
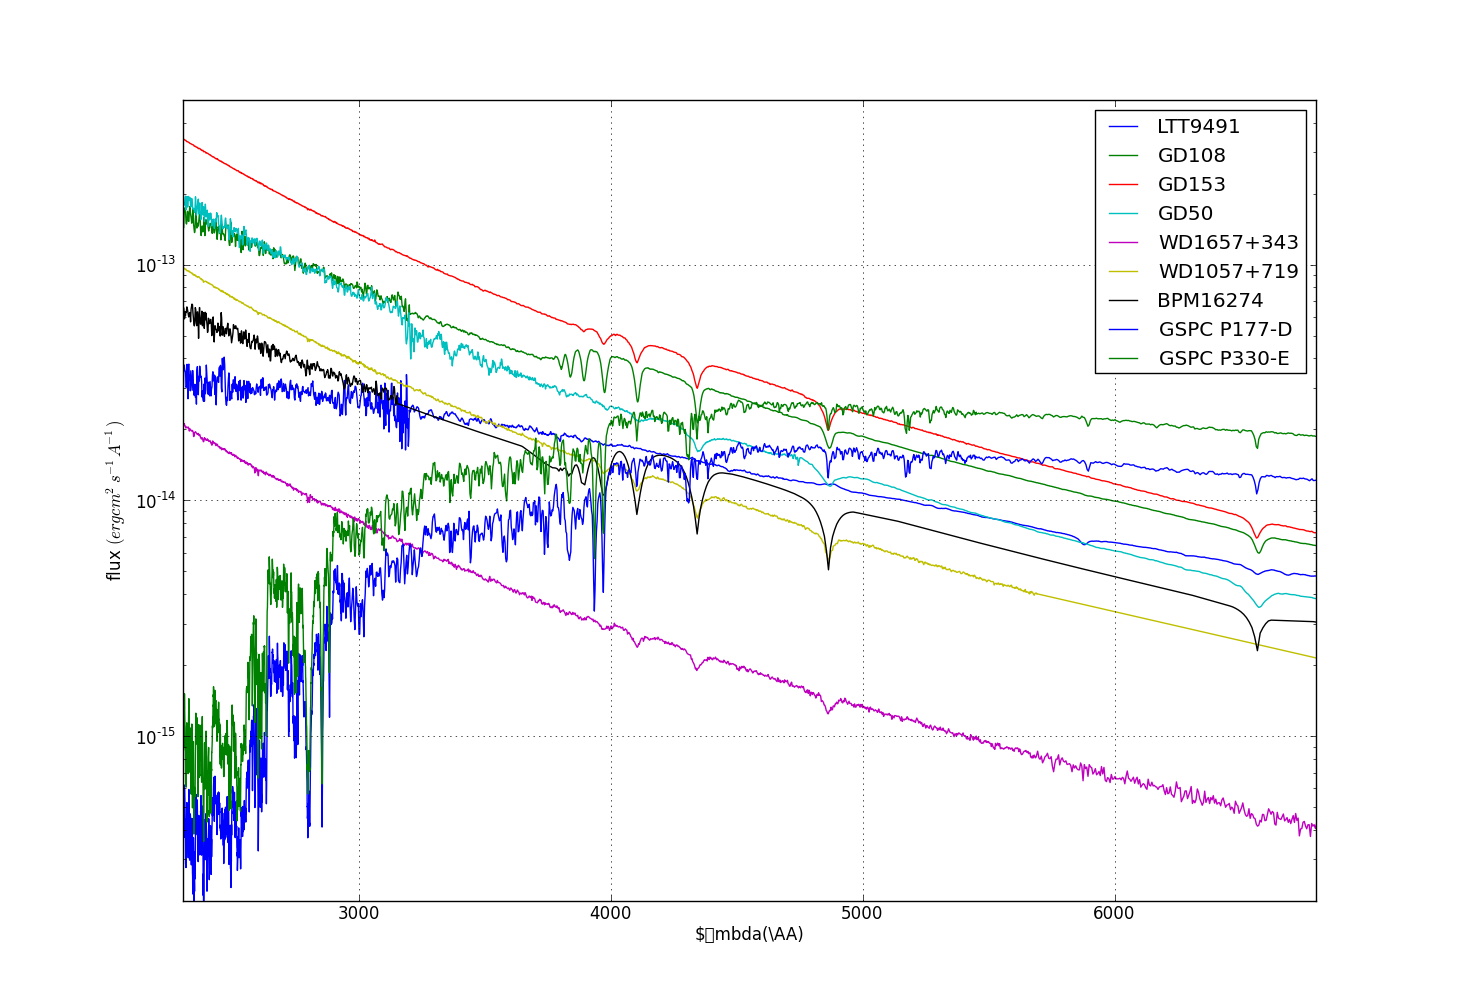
All reference calibration spectra are shown.
WD1121+145 has about the same flux as WD1657+343. A lower flux means less coincidence-loss during the observation.
Coincidence-loss as a function of brightness
In order to show the level of coincidence-loss, the following figure has been made for the observations near the default location on the detector. The default location (boresight) is at [1140,1030] (detector coordinates) for the visual grism nominal mode.
The following figure shows the coi-factor for the uvot spectra taken from the reference sources.
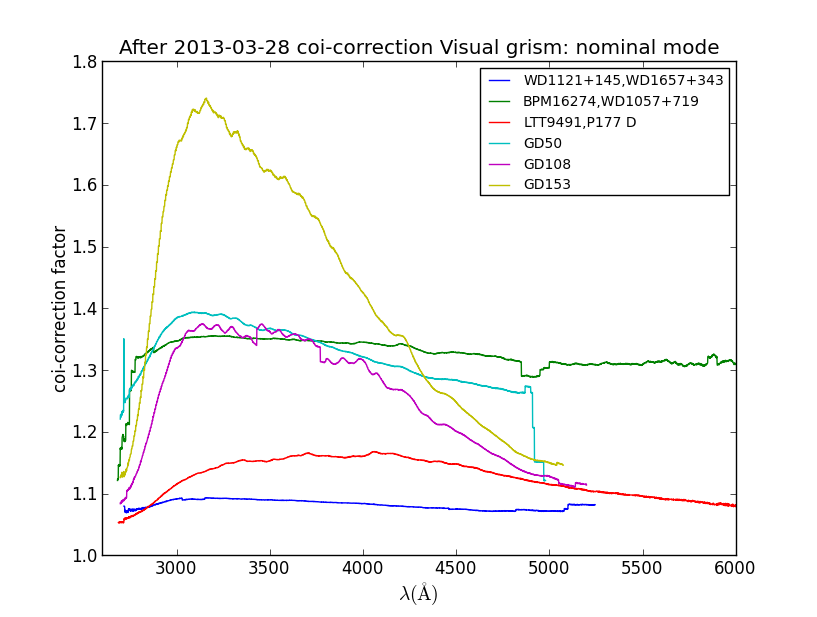
For selected spectra averages of the coi-factor are shown. The coi-factor is essentially the coi-corrected flux divided by the (uncorrected) reference spectrum flux. It depends on the flux level and the effective area, so is highest where the flux is brightest.
The coincidence-loss due to the background dominates the correction for WD1121+145 and WD1657+343.
Caution:
The current coi-correction method is based on an ad-hoc assumption and
fit to the uv-grism data. A theoretical approach has been developed to
get a better correction, but that has not yet been implemented for this
calibration. As a result the effective area from very weak spectra and
from much stronger spectra are not completely aligned.
Effective Areas
At the default position on the detector
The effective area curve based on the spectra from sources of differing brightness, coincidence-loss corrected with the current ad-hoc method is good to within 10%. To illustrate this, I first show the derived effective area at the default position, where for each calibration target all available spectra were used. Next I show for various positions on the detector the derived effective area curve, but this time spectra from all targets at each location are used.
The figure below shows the effective areas at the default location. The effective areas at that location derived for sources of different brightness are shown.
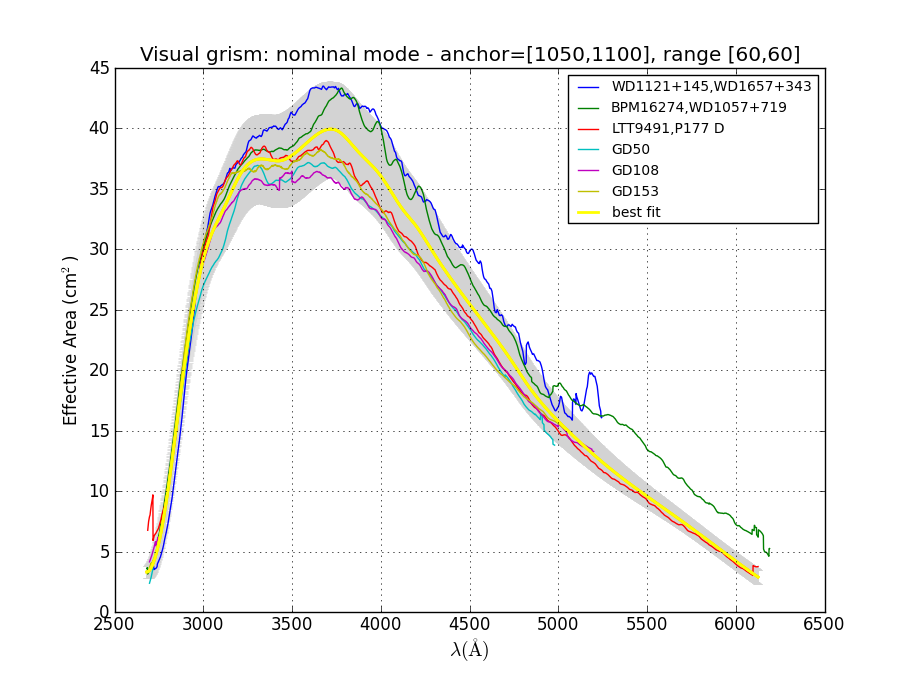
The effective area derived for the default position is shown in yellow with a grey shaded band for the error. The fainter sources have the larger effective area.
Whereas without coincidence-loss correction the effective area derived using GD153 would be 50% below that from the faint white dwarfs WD1121+145 and WD1657+343, with the coi-correction the effective areas are quite close. The current result suggests that the coincidence loss when dominated by the background is not consistent with that dominated by the spectrum. It is consistent with some changes in the coming revision of the coincidence-loss model for the grism.
For wavelengths over 4900A, the second order causes deviations.
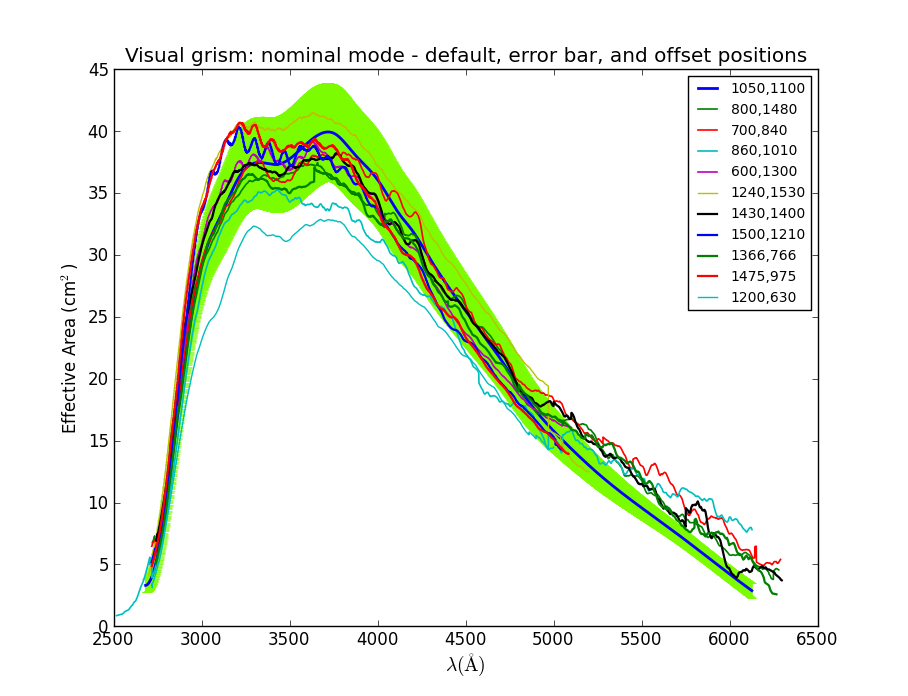
Selected areas for effective area calibration
Effective areas at different detector locations are shown in the following figures. The selected areas are identified by the centre of their location in the figure legend. The selection was to a large extent determined by where the available spectra of both host and cool sources fell on the detector, and so are placed in a rather unorganised manner over the detector.
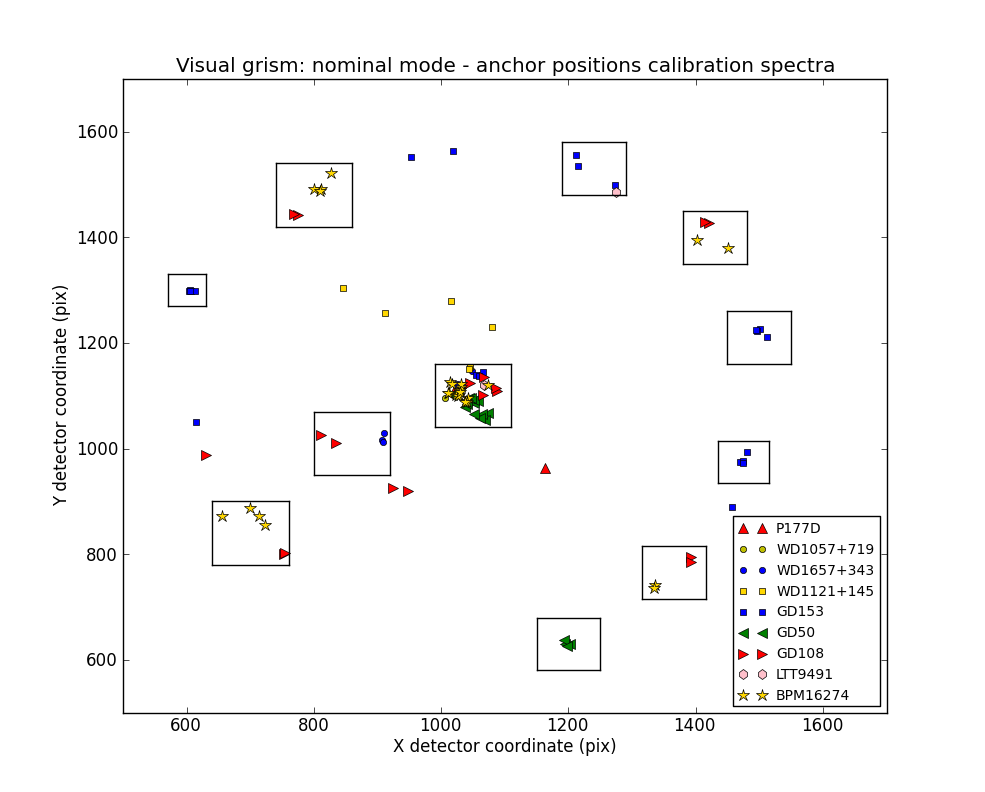
The effective area were derived for the default position in the middle and at various locations, mostly about 3 arcmin away, as indicated by the boxed areas.
The effective area variation over the detector
As can be seen, at most offset positions the effective area is derived from a host of different targets, which we have seen to show different levels of coincidence loss. It is therefore difficult at this moment to attribute the variations in derived effective area entirely to a variation in response over the detector. However, the location at [1200,630] clearly has a much reduced response, while that at [1240,1530] has a much higher response.
The effective area were derived for the default position in the middle and at various locations, mostly about 3 arcmin away, as indicated by the boxed areas.
It should be noted that the oscillatory behaviour for some of the effective area curves is due to high coincidence loss where the only available calibration spectra were GD153, which at 3200A reached a peak 1.7 coi-correction factor. The pixel-to-pixel effect of coincidence loss extends over about 27.7 pixels, leading to that oscillatory pattern, and destroying the one-to-one correspondence of measured counts in a pixel and indicent flux. Hence, the upper limit of brightness for the visual grism is about \(5x10^{-14} erg\ cm^2\ s^{-1}\). The effect is also illustrated in the spectra comparing the reference spectra to the visual grism observations like in GD153 Figure 2.
Note:
It is to be expected that the final coincidence-loss correction will
change the associated coi-corrected effective area closer to that of
the faint sources, while giving a larger correction to the brighter
sources.
A new calibration file incorporating the effective areas at the different offsets has been made. The performance of the calibration is discussed further at Verification of the flux calibration in the visual grism: nominal mode.
Performance of the new flux calibration
An internal consistency check of the calibration is obtained from using the new calibration file with the calibration spectra as shown below. First we show three sources at the default position. GD153, which is very bright for the instrument first, and ending with the faintest.
default position
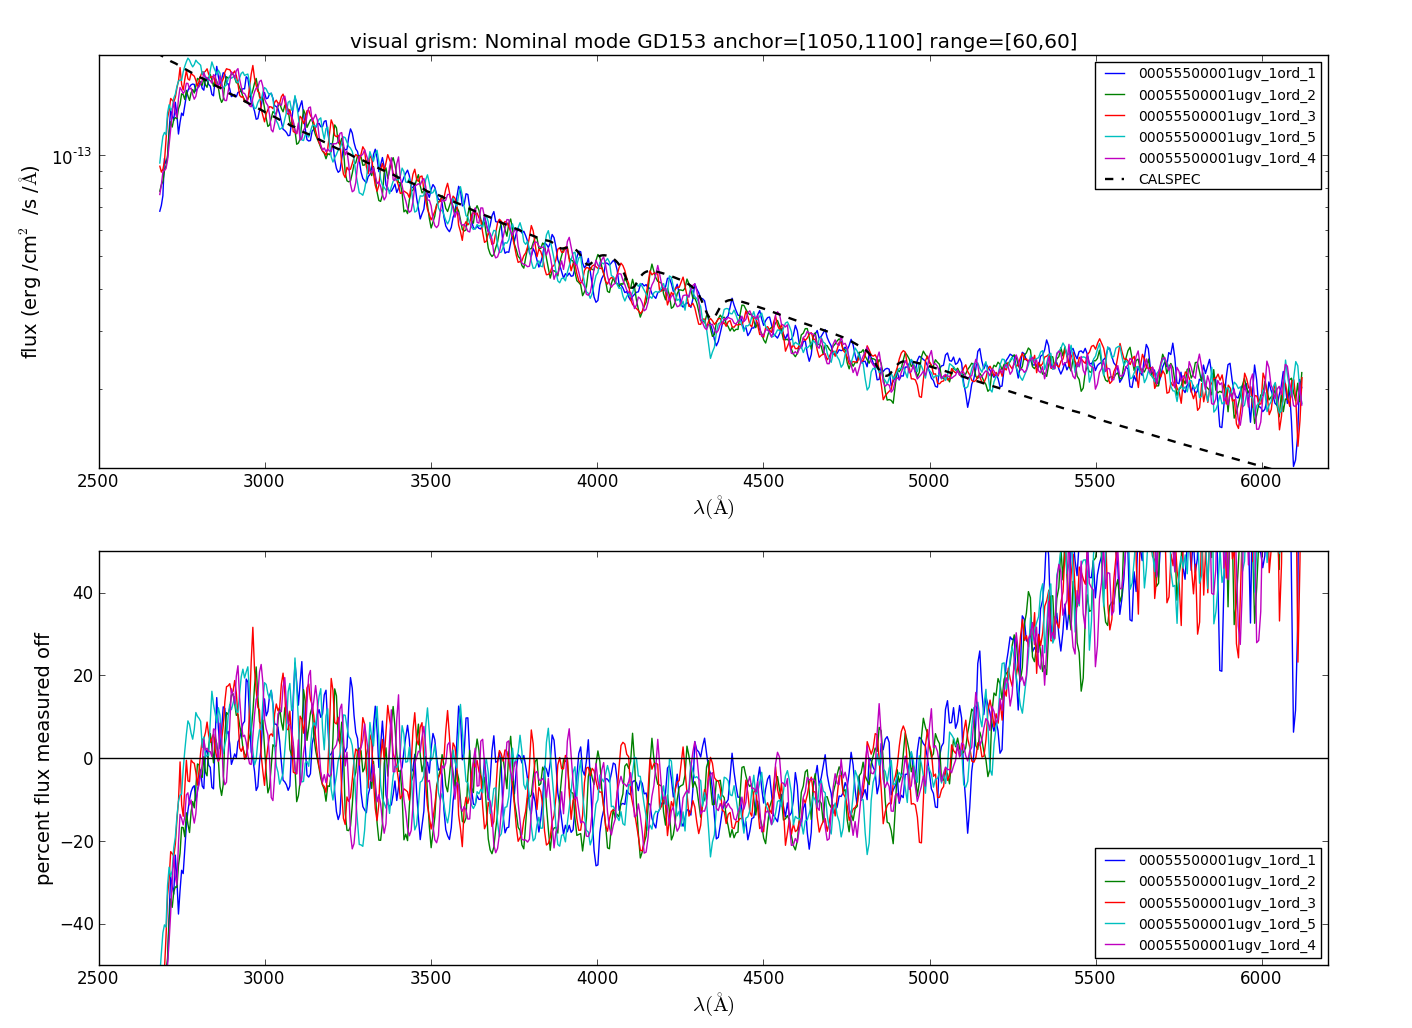
GD153 is the brightest calibration source and has appreciable coincidence loss
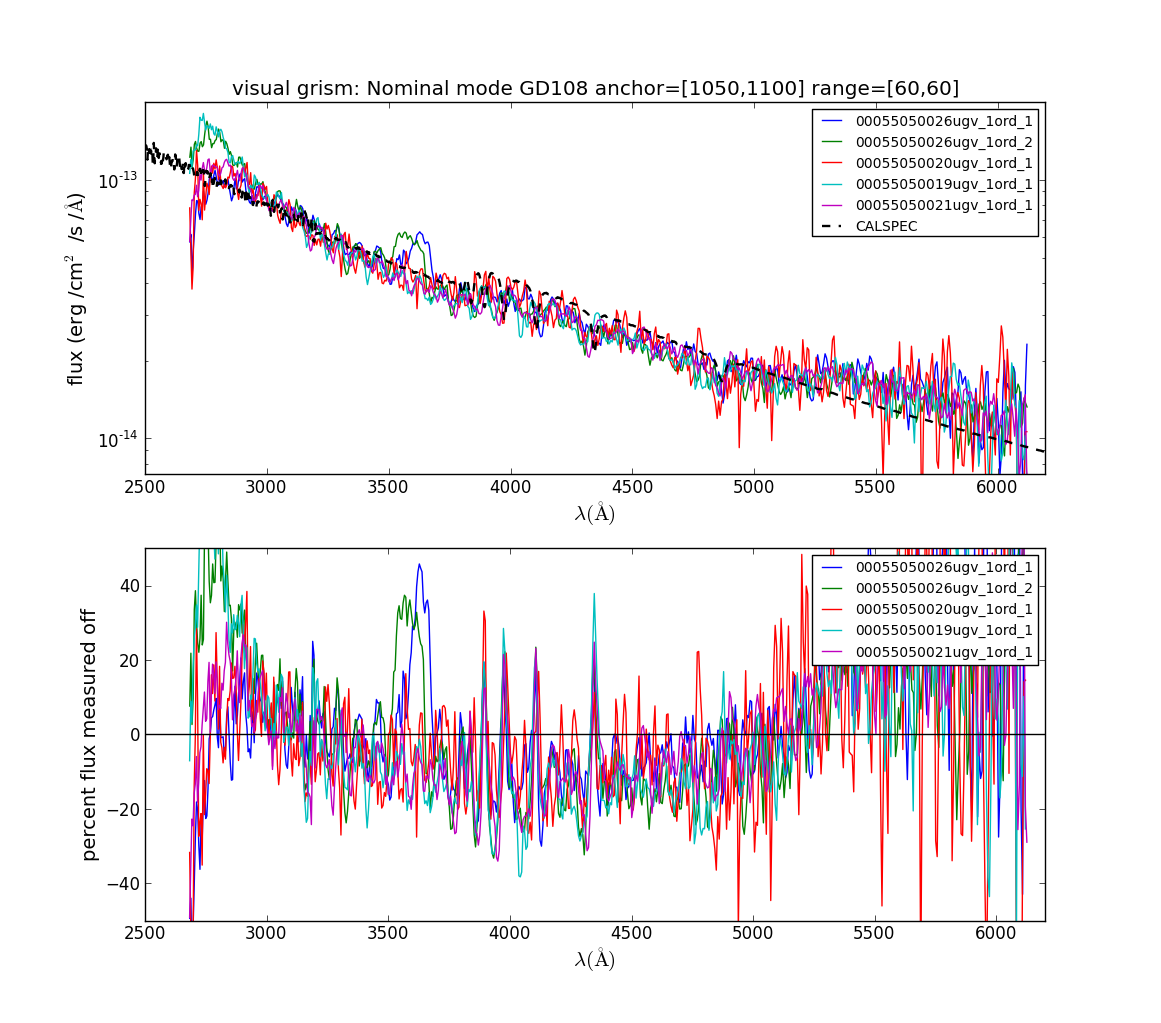
GD108 is still a rather bright source for the UVOT V grism, and suffers a lot of coincidence loss.
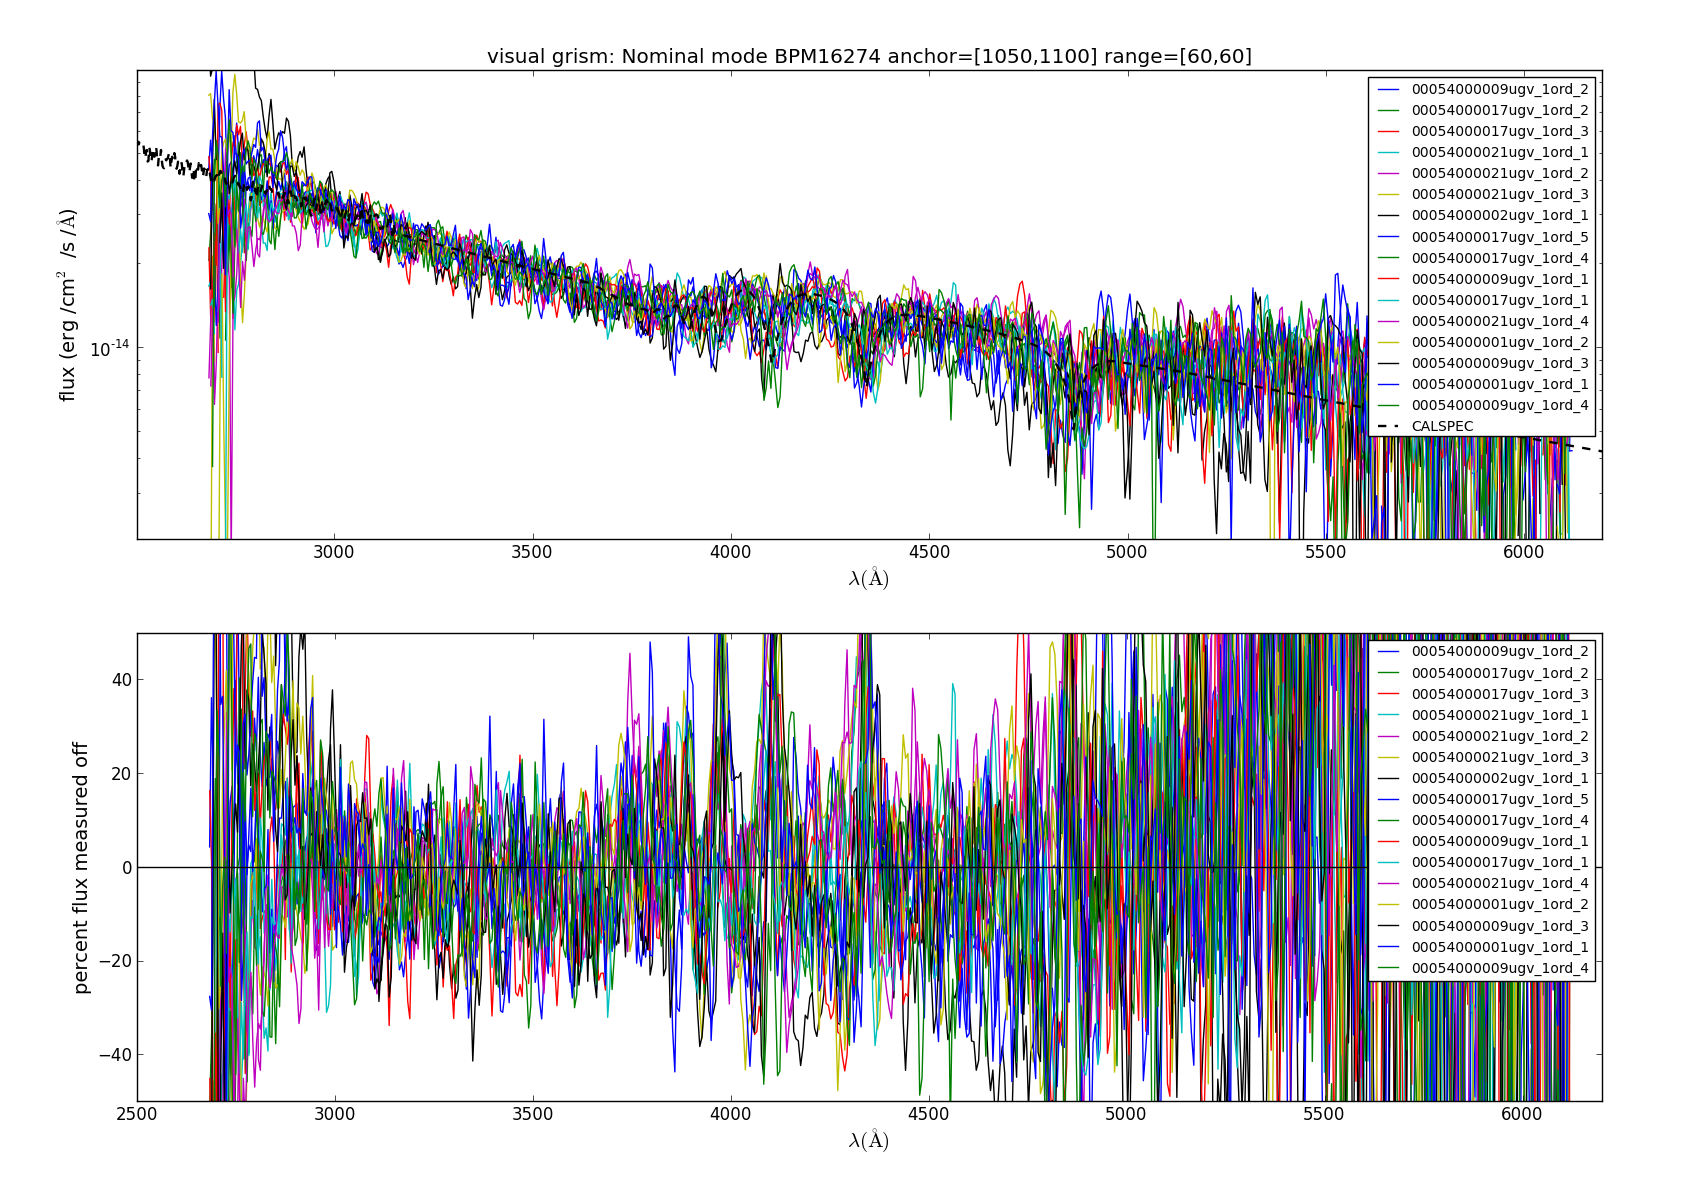
BPM16274 is in the range between too much coincidence loss and to much noise due to being faint.
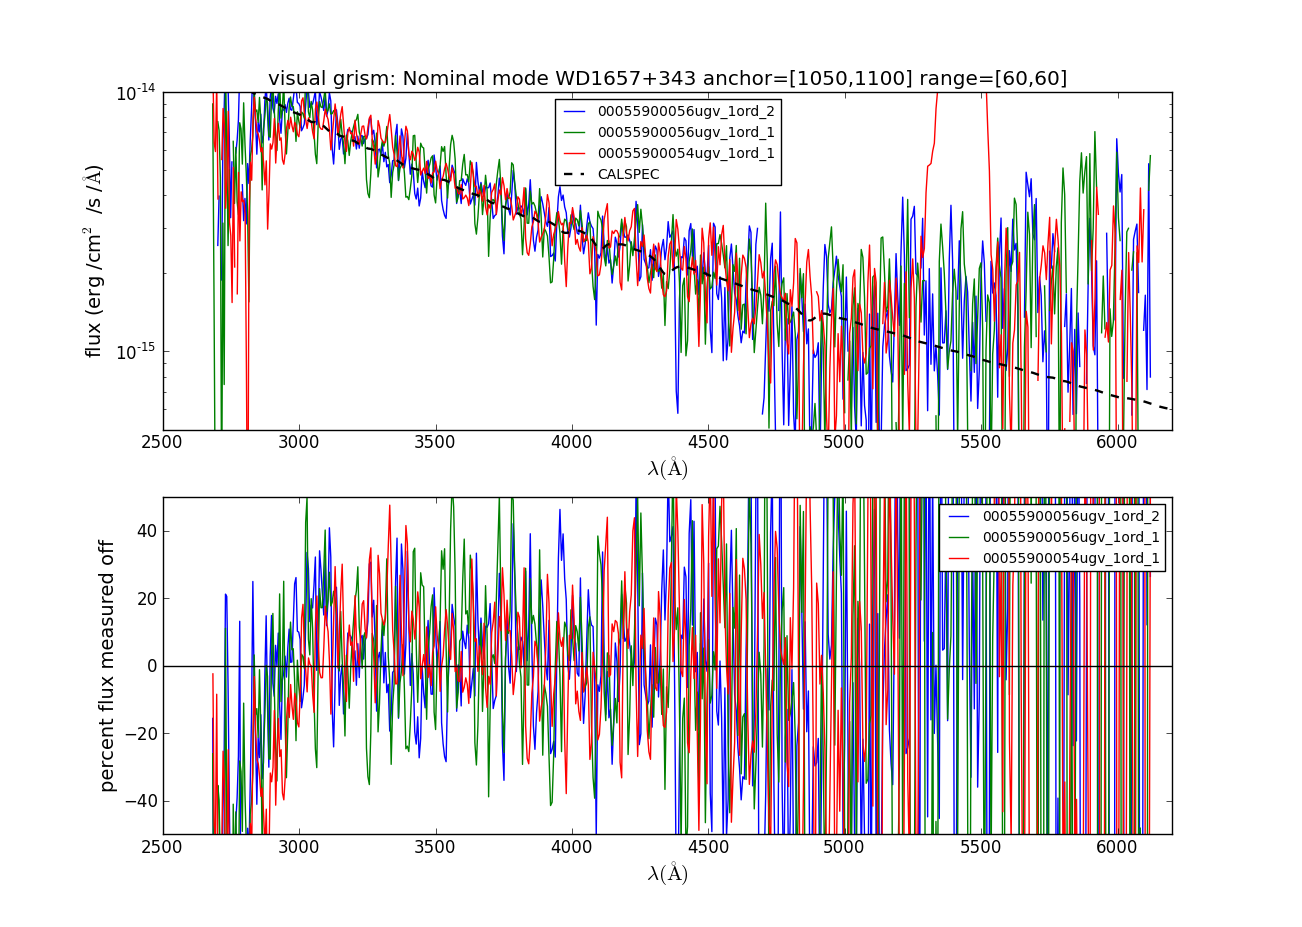
WD1657+343 is weak as compared to the background. Much fainter sources will be too noisy.
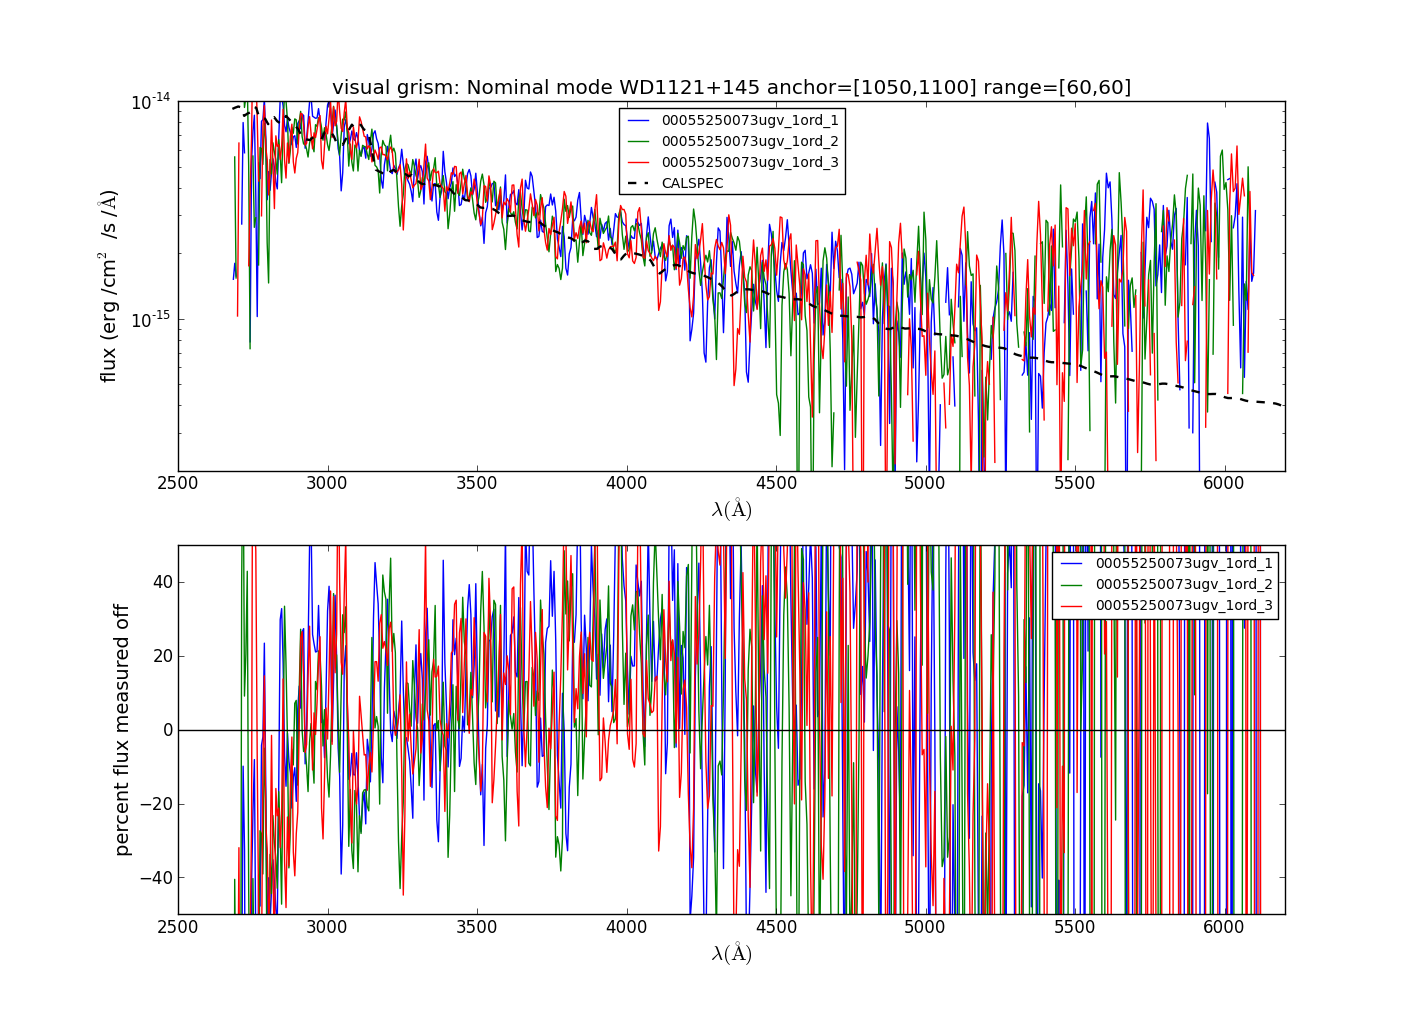
For WD1121+145 the same can be said as for WD1657+343.
Taking them all in, the accuracy of the flux calibration is within about 20%. There is a downturn in the fluxes below 2900A in the WD spectra, just like in the original calibration. This can be adjusted in the next version.
offset position [800,1480]
I am showing the comparison at only one offset position which was randomly picked.
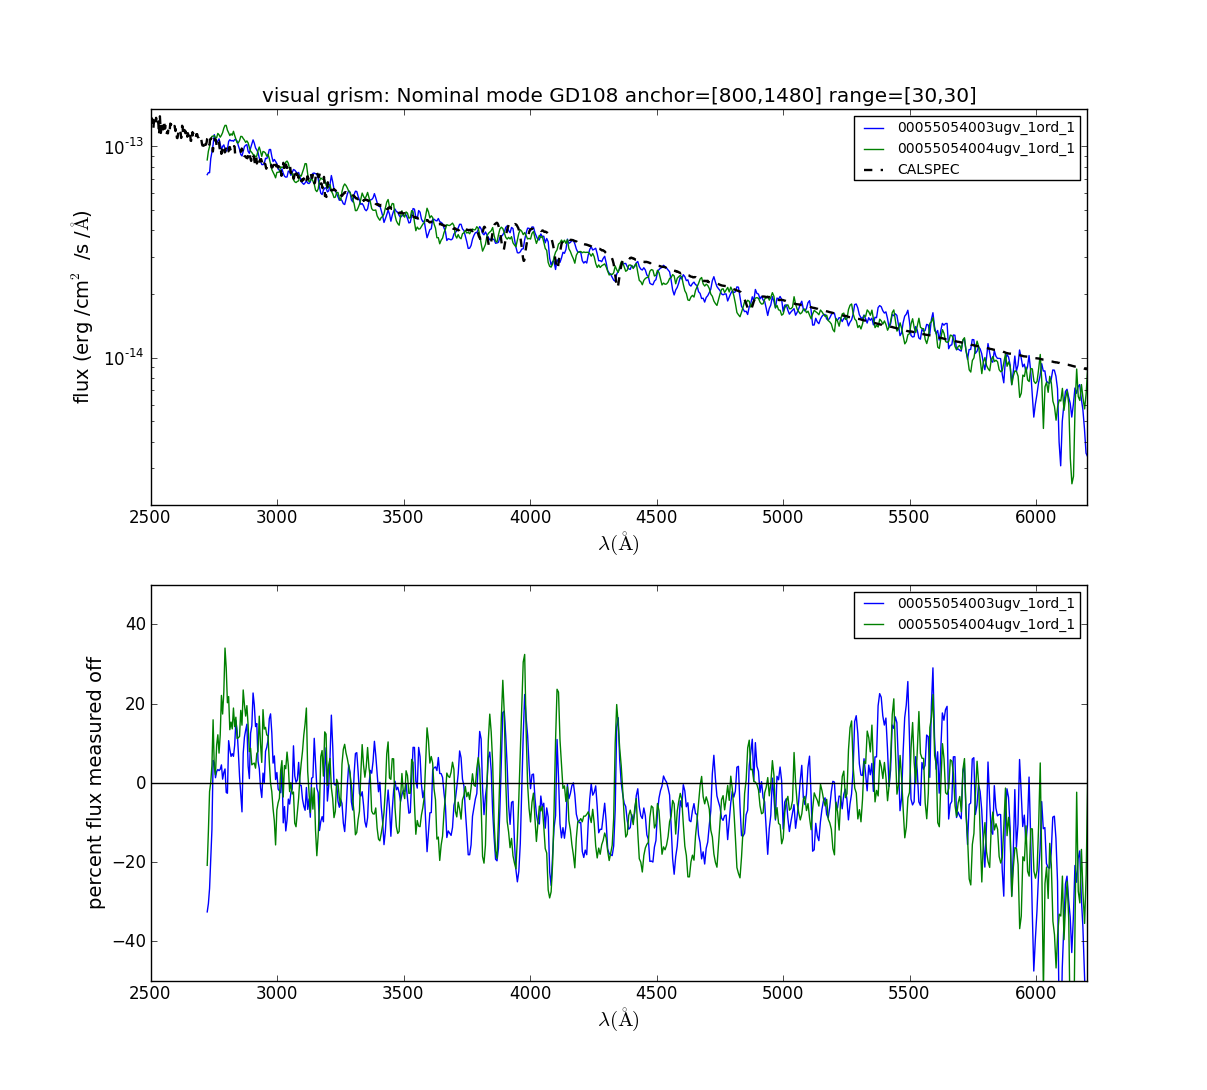
GD108 is quite a bright WD for the UVOT V grism with a lot of coincidence loss
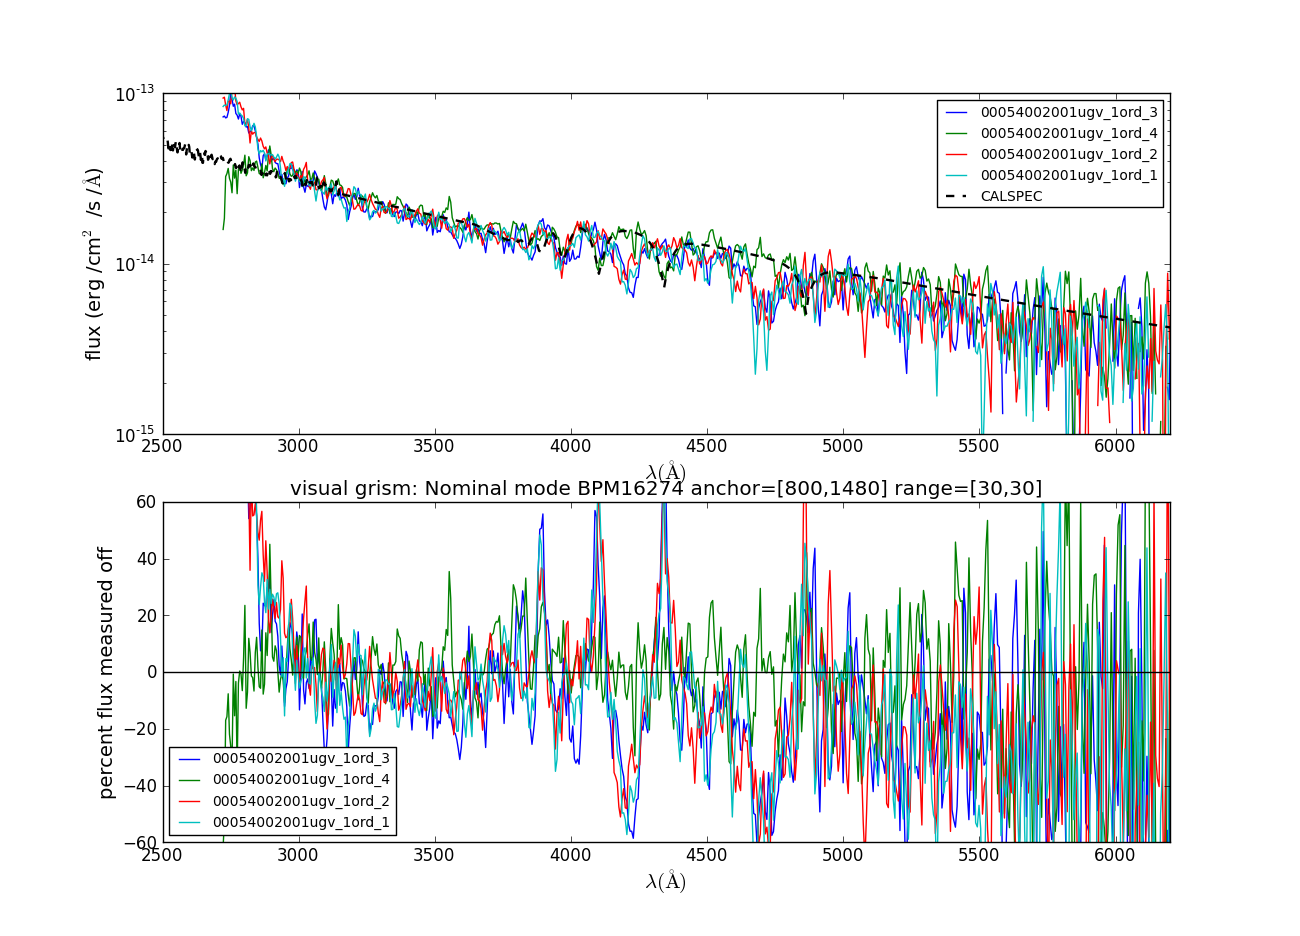
BPM16274 still has coincidence loss at about 30%, so much larger then that from the background, but has a good S/N.
Some sudden drops in the flux can be seen in some spectra which have not been investigated further at the moment but may be due to an offset in the wavelength scale. Nearly all these spectra were processed using the ftool uvotgraspcorr in order to position the source. Some large offsets were seen during the work on the effective area (as large as 26 pixels i.e., 160A in some cases).
Finally, the accuracy of the effective area was verified in Verification of the flux calibration in the visual grism: nominal mode.