
Verification of the flux calibration in the UV clocked grism
Overview
The new uv-grism flux calibration is valid over the whole
detector, and makes also a correction for coincidence-loss.
The first integrated software version is UVOTPY-0.9.7.0,
but we will do the verification to the 0.9.7.1 version which
has patches for the sensitivity-loss and flux model
interpolation.
With the choice of data, we have an independent set from the spectra used to construct the effective area. Of course, spectra from the same targets are used.
Method
Calibration spectra that were not used in the flux calibration are reprocessed using the new flux calibration and then compared to the known stellar flux. The spectra for verification are located on the detector between the areas with the spectra used to determine the effective areas for the flux calibration.
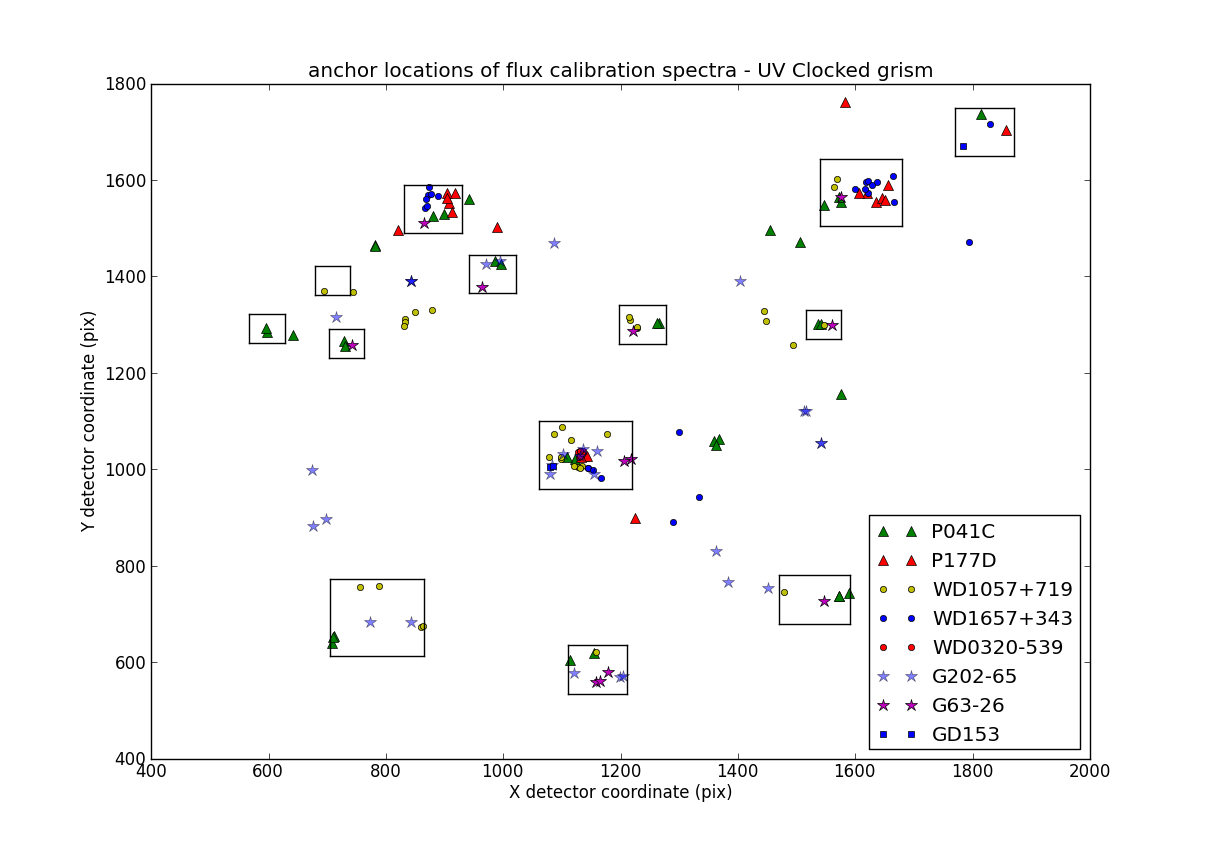
Figure 1: The anchor positions of the calibration spectra marked by target. The boxes are enclosing sources used to derive an effective area for the location of the box.
Data used for verification
The approximate location of the anchor of the spectra, their
obsid, and number of the fits extension is listed.
First the cool stars are listed, followed by the hot white dwarfs.
GSPC-P041C spectra (F0 V)
| anchor | obsid |
ext |
% err | plot | aspect correction |
|---|---|---|---|---|---|
| 781,1459 | 00057965002 | 1,2 | 24 | GSPC-P041C Figure 1 This spectrum with anchor at [781,1459] is affected by the decreasing sensitivity in this part of the detector. | yes,yes |
| 641,1275 | 00057964002 | 2 | 18 | GSPC-P041C Figure 2 This spectrum with anchor at [641,1275] is affected by the decreasing sensitivity in this part of the detector. | yes |
| 940,1553 | 00057972002 | 1 | 1 | GSPC-P041C Figure 3 This spectrum has its anchor at [940,1553]. | yes |
| 1361,1051 | 00057960002 | 1,2,3 | 1.5 | GSPC-P041C Figure 4 This spectrum has its anchor at [1361,1051]. | yes,all |
| 1578,1151 | 00057969001 | 3 | 6 | GSPC-P041C Figure 5 This spectrum has its anchor at [1578,1151]. | yes |
| 1454,1494 | 00057958001 | 2 | 1 | GSPC-P041C Figure 6 This spectrum has its anchor at [1454,1494]. | yes |
| 1506,1464 | 00057958001 | 1 | 4 | GSPC-P041C Figure 7 This spectrum has its anchor at [1506,1464]. | yes |
GSPC P177D spectra (F0 V)
| anchor | obsid |
ext |
% err | plot | aspect correction |
|---|---|---|---|---|---|
| 1586,1756 | 00056762002 | 4 | 17 | GSPC-P177D Figure 1 This spectrum has its anchor near [1586,1756]. | yes |
| 993,1496 | 00056763002 | 6 | 1 | GSPC-P177D Figure 2 This spectrum has it anchor near [993,1496]. | yes |
| 821,1491 | 00056763002 | 2 | 3 | GSPC-P177D Figure 3 This spectrum has its anchor near [821,1491]. | yes |
| 1229, 889 | 00056760002 | 1 | 8 | GSPC-P177D Figure 4 This spectrum has its anchor near [1229,889]. | yes |
The error is calculated as the mean of the flux difference
over a good region of the spectrum, and
is considered to be a measure of the error in the flux level.
The flux was calibrated using uvotpy.uvotio.rate2flux default
option with anchor position given.
WD1657+343 spectra
| anchor | obsid |
ext |
% err | plot | aspect correction |
|---|---|---|---|---|---|
| 1797,1467 | 00055903006 | 1 | 1 | WD1657+343 Figure 1 This spectrum has its anchor near [1797,1467]. A large zeroth order is present contaminating the 4300A region. | yes |
| 1338, 941 | 00055900050 | 1 | 4 | WD1657+343 Figure 2 This spectrum has its anchor near [1338, 941]. | yes |
| 1291, 891 | 00055900050 | 3 | 9 | WD1657+343 Figure 3 This spectrum has its anchor near [1291, 891]. | yes |
| 1302,1082 | 00055900050 | 2 | 5 | WD1657+343 Figure 4 This spectrum has its anchor near [1302,1082]. | yes |
WD1057+719 spectra
Results
Although the number in the table for the error is based on the mean,
since the total exposure time was not long enough to beat down the
noise enough, it appears that over most of the detector the flux calibration
is within 10% or better. As expected, the flux is most uncertain near the
sudden drop in response. The current calibration file (version 002) used
with the current uvotpy version (0.9.7.1) give a fit to within
about 15%. The largest deviations seem related to contamination of the
spectrum by the spectra from other sources in the field, and of course
from the second order.
I should mention that the limit on the errors is so some degree dominated by the noise in the data. The error in the flux calibration as determined from the calibrated areas (see the boxes in the figure above,) is more reliable since the total exposure time in those areas is larger.
The wavelength scale errors are quite apparent. Errors in the anchor position cause wholesale shifts of the scale, while the dispersion at long wavelengths is not correct (> 4000A) at present. The zemax model which was used for the dispersion turned out to be not correct, and an update of the dispersion is planned. That in turn causes large swings in the comparison of the flux from the extracted spectra (which were not shifted) and the reference spectra. The anchor positions were determined using lenticular files taken before or after the grism exposure in the same Swift “mode”, meaning that no slew took place between grism and corresponding exposure in one of the lenticular filters. However, occasionally drift of the pointing occurs, especially noticable in the weaker spectra with more than 1000 second exposure times.