
Figures for the uv grism : clocked mode
These figures go with the description Verification of the flux calibration in the UV clocked grism, and show in the top panel the observed flux and the reference spectrum which is usually taken by HST. The sources are calibration sources with the exception of G202-65.
In the bottom panel is plotted (observed - reference)/reference as a percentage. Notice that the bottom plot gets very noisy when the source flux is low. This is due to noise in the data. Also, at longer wavelengths second order contamination raises the observed flux, setting in at a wavelength that depends on the location of the blue rise of the spectrum.
The following sources are being used for verification
GSPC-P041C spectra (F0 V)
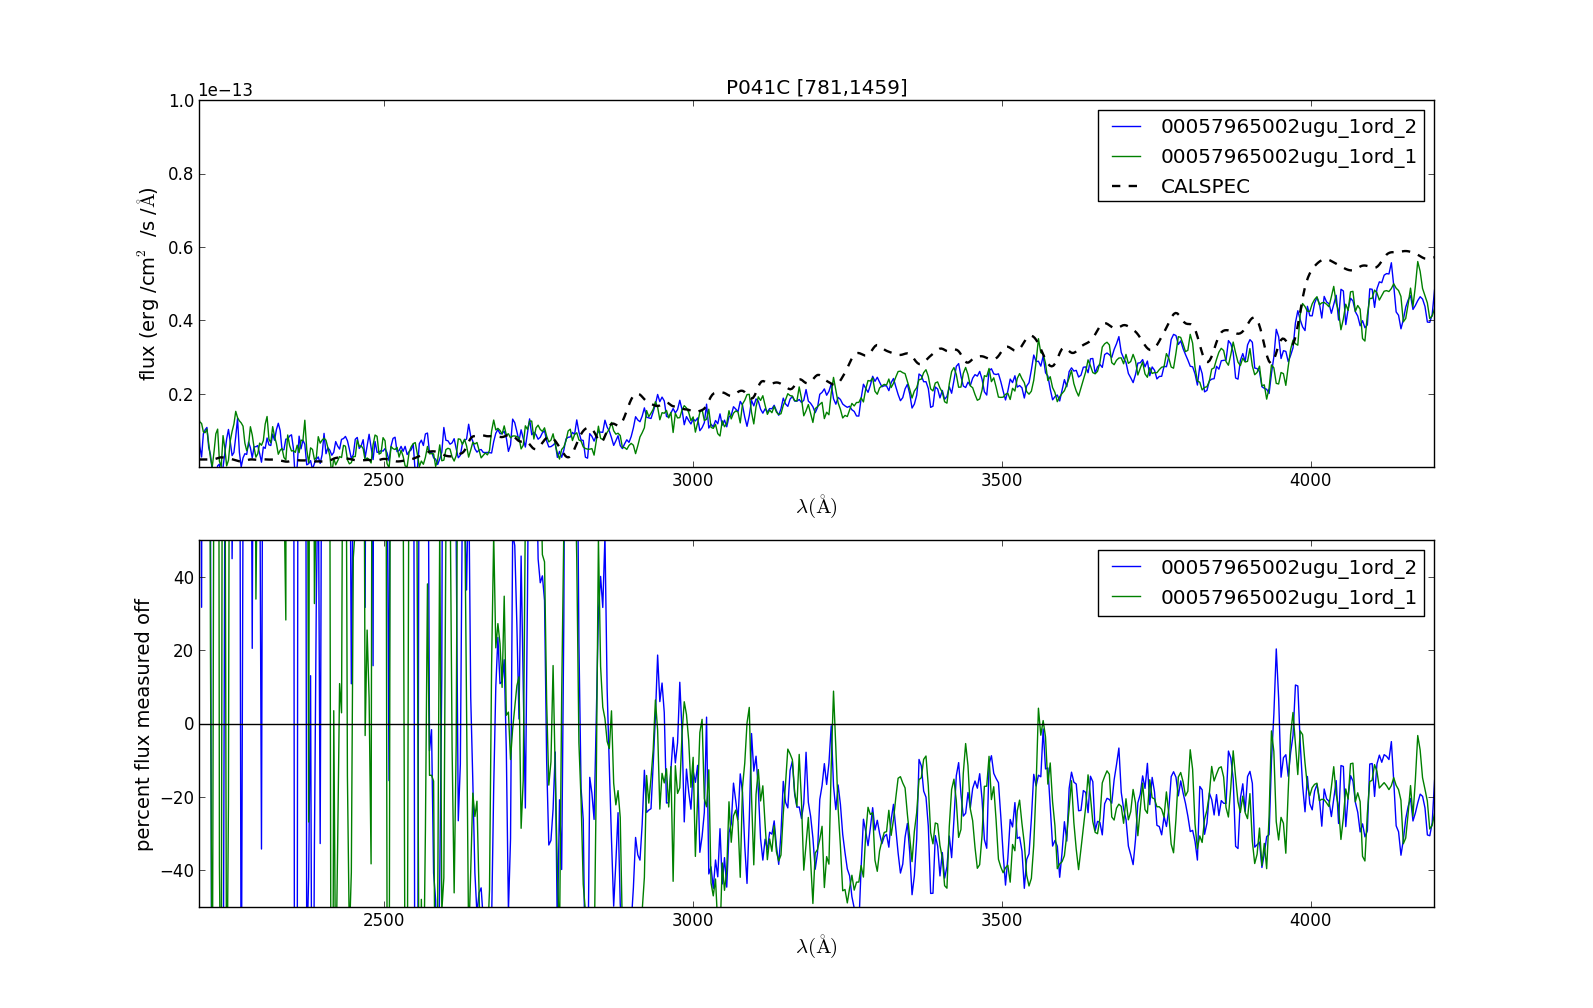
GSPC-P041C Figure 1 This spectrum with anchor at [781,1459] is affected by the decreasing sensitivity in this part of the detector.
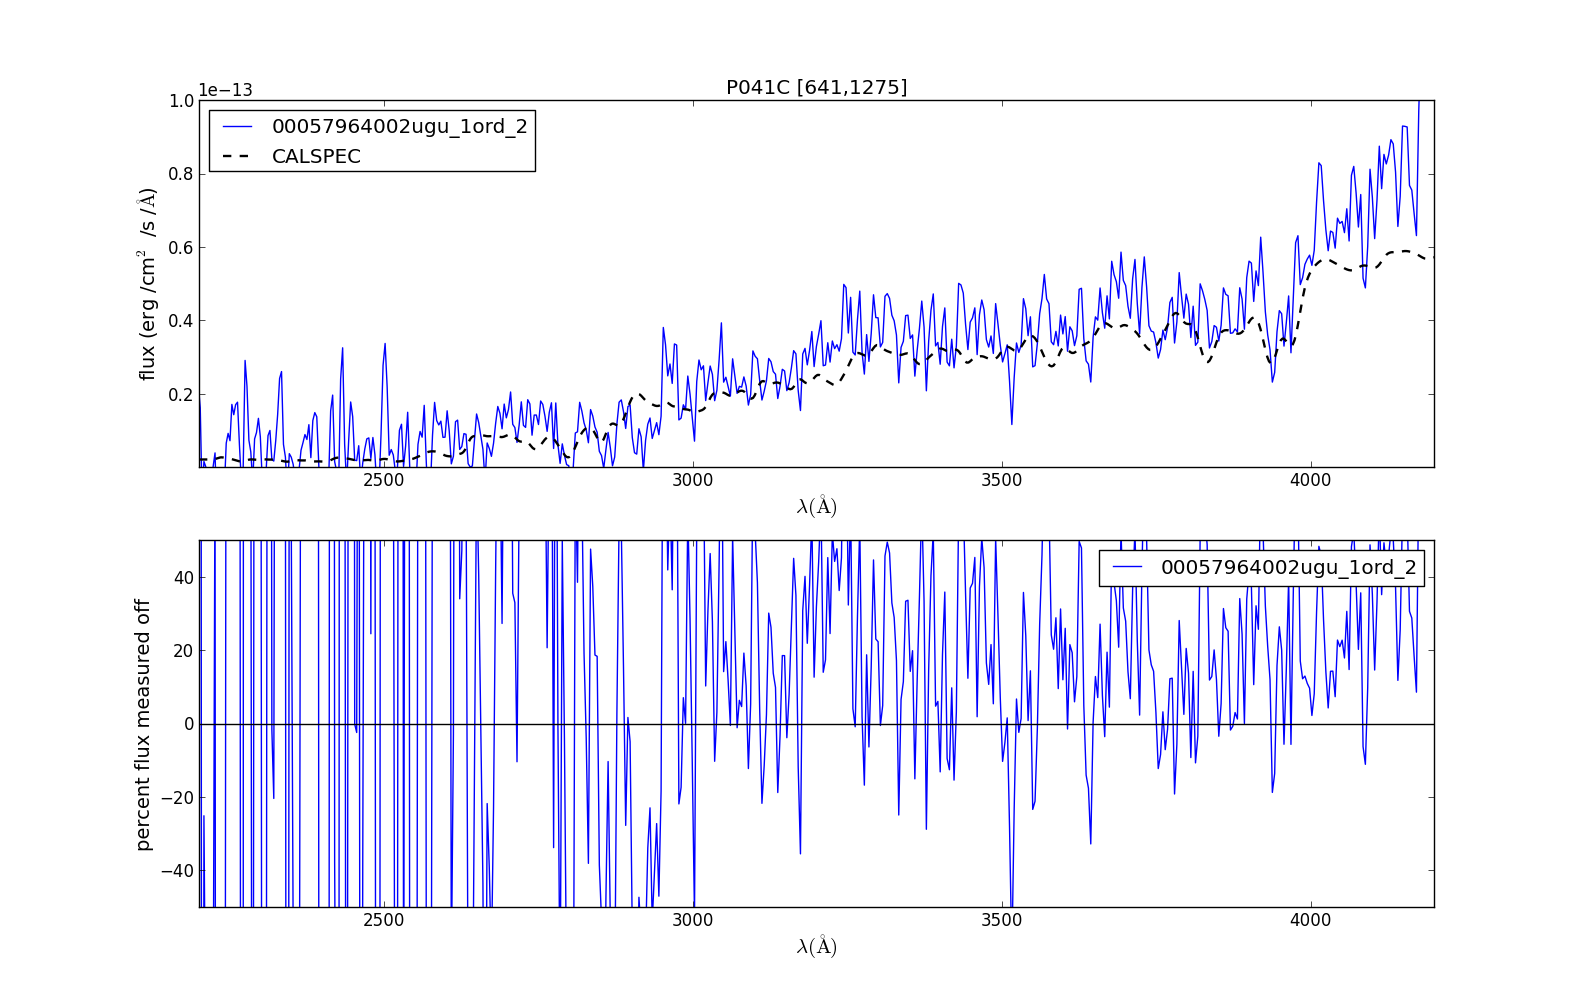
GSPC-P041C Figure 2 This spectrum with anchor at [641,1275] is affected by the decreasing sensitivity in this part of the detector.
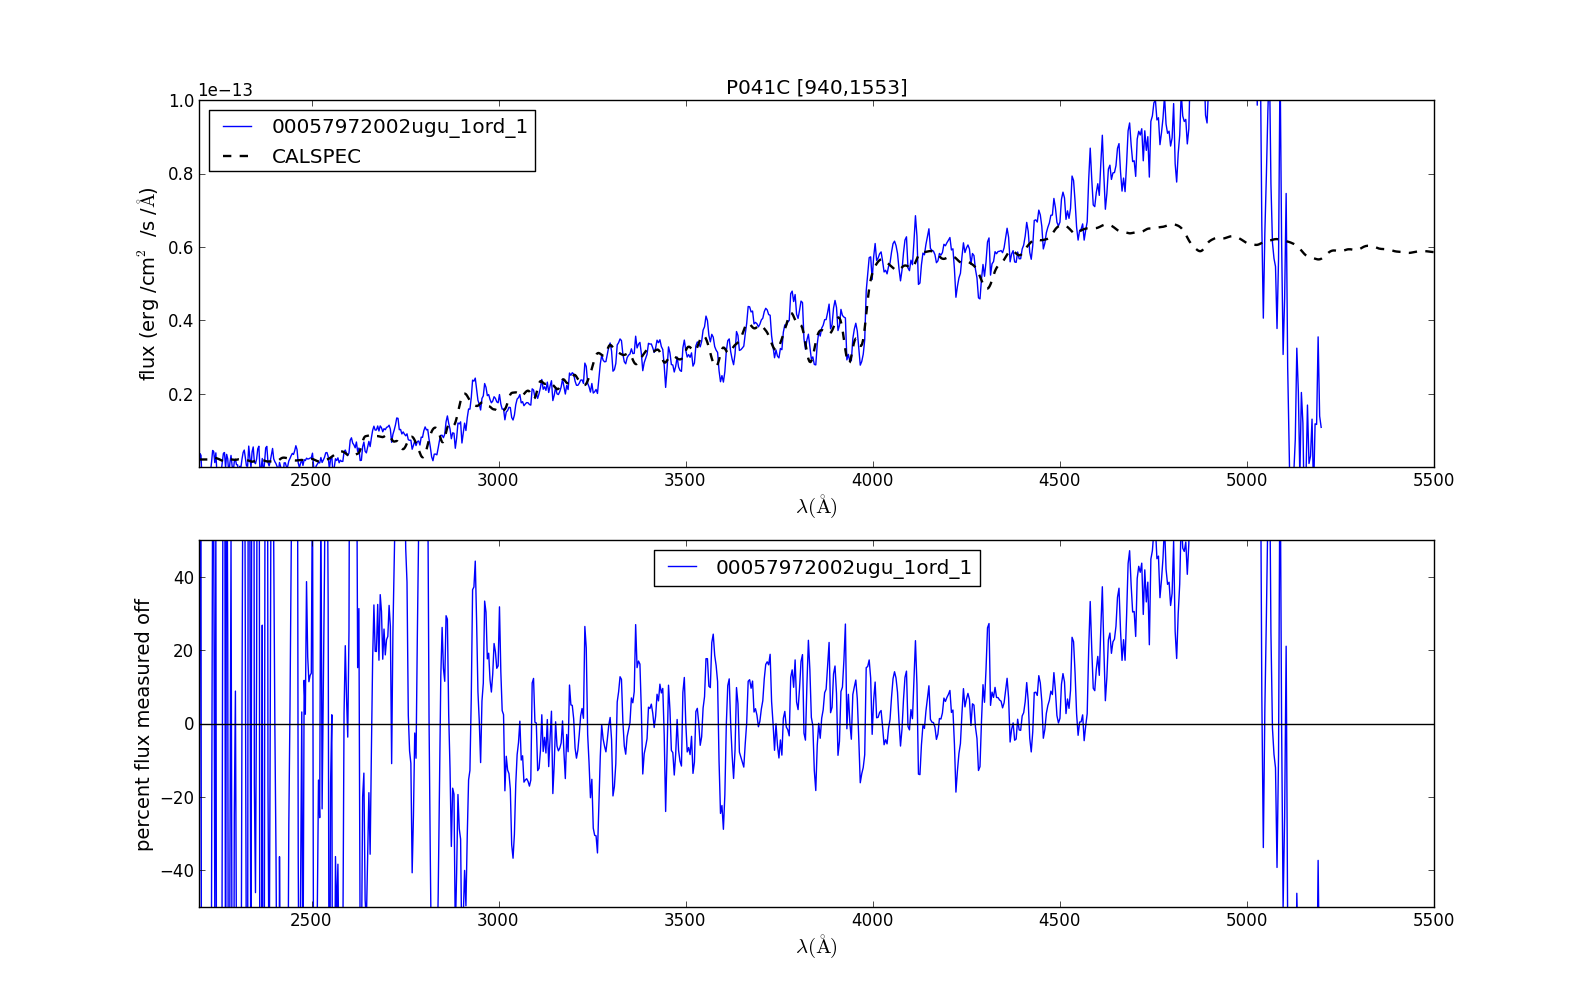
GSPC-P041C Figure 3 This spectrum has its anchor at [940,1553].
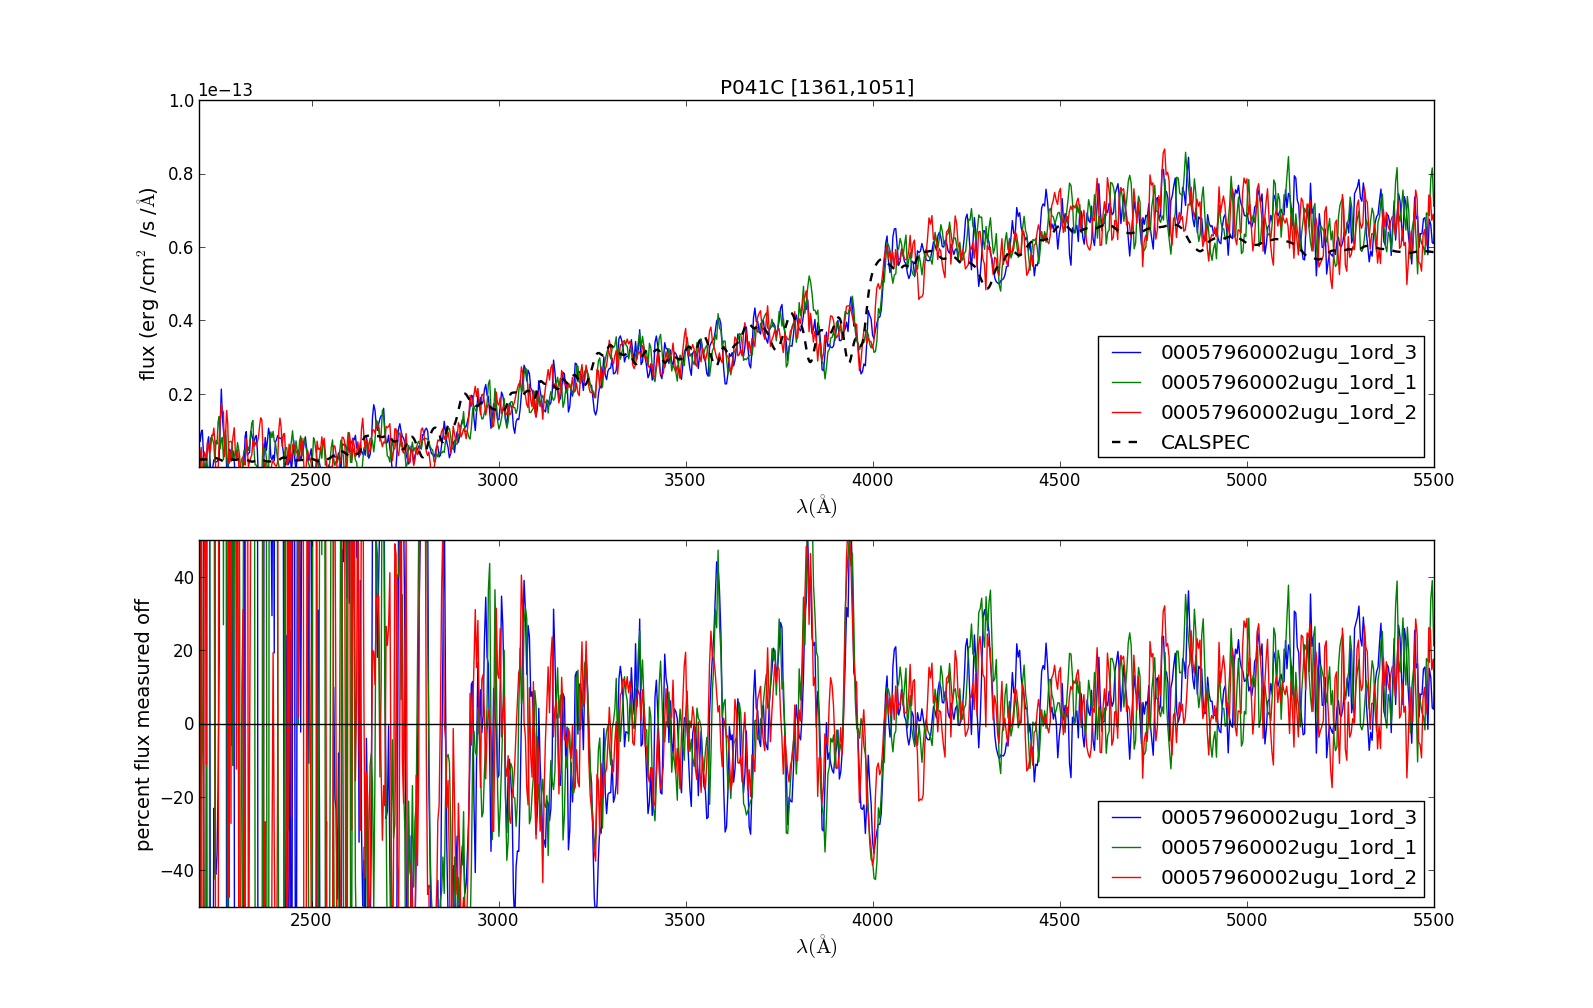
GSPC-P041C Figure 4 This spectrum has its anchor at [1361,1051].
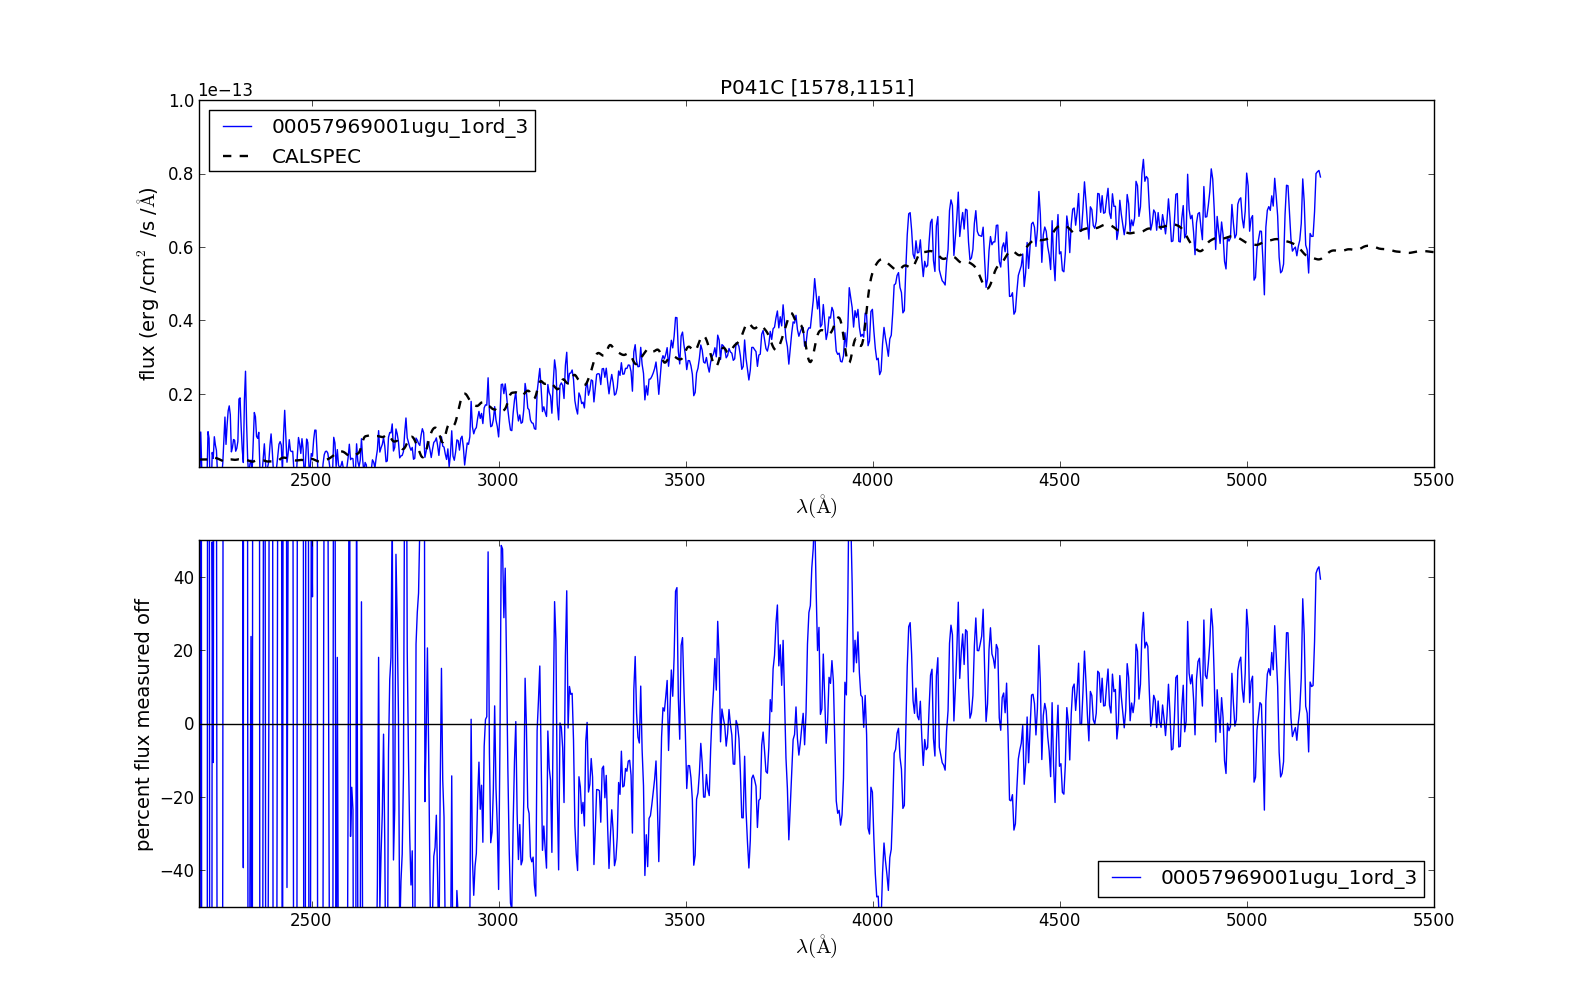
GSPC-P041C Figure 5 This spectrum has its anchor at [1578,1151].
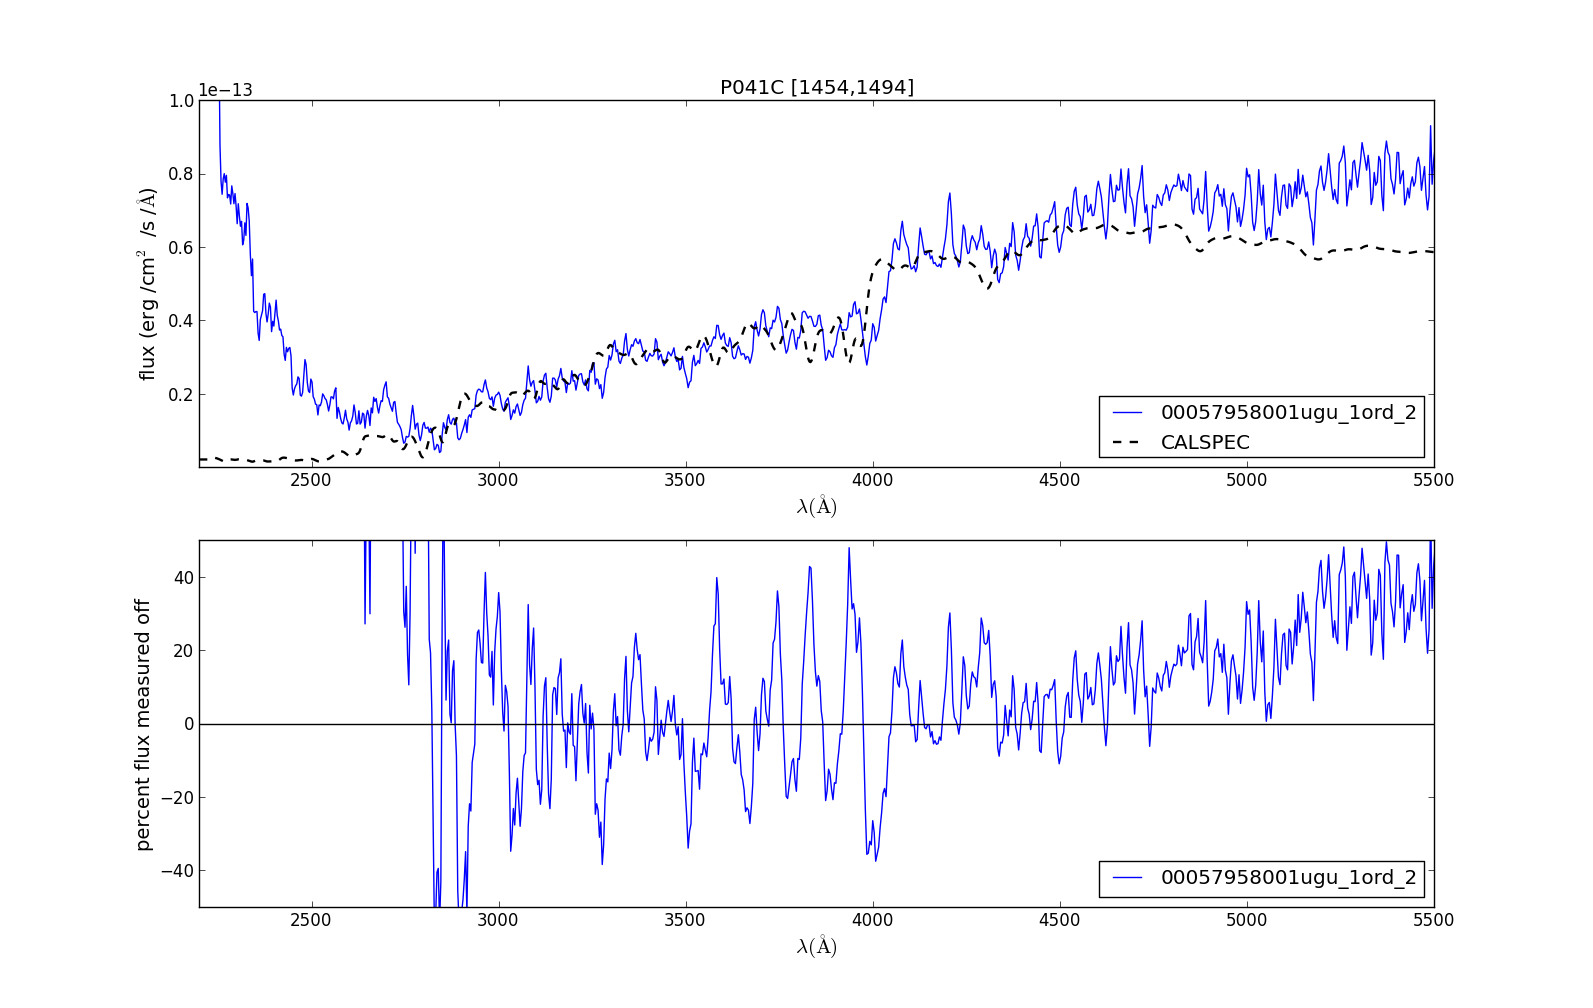
GSPC-P041C Figure 6 This spectrum has its anchor at [1454,1494].
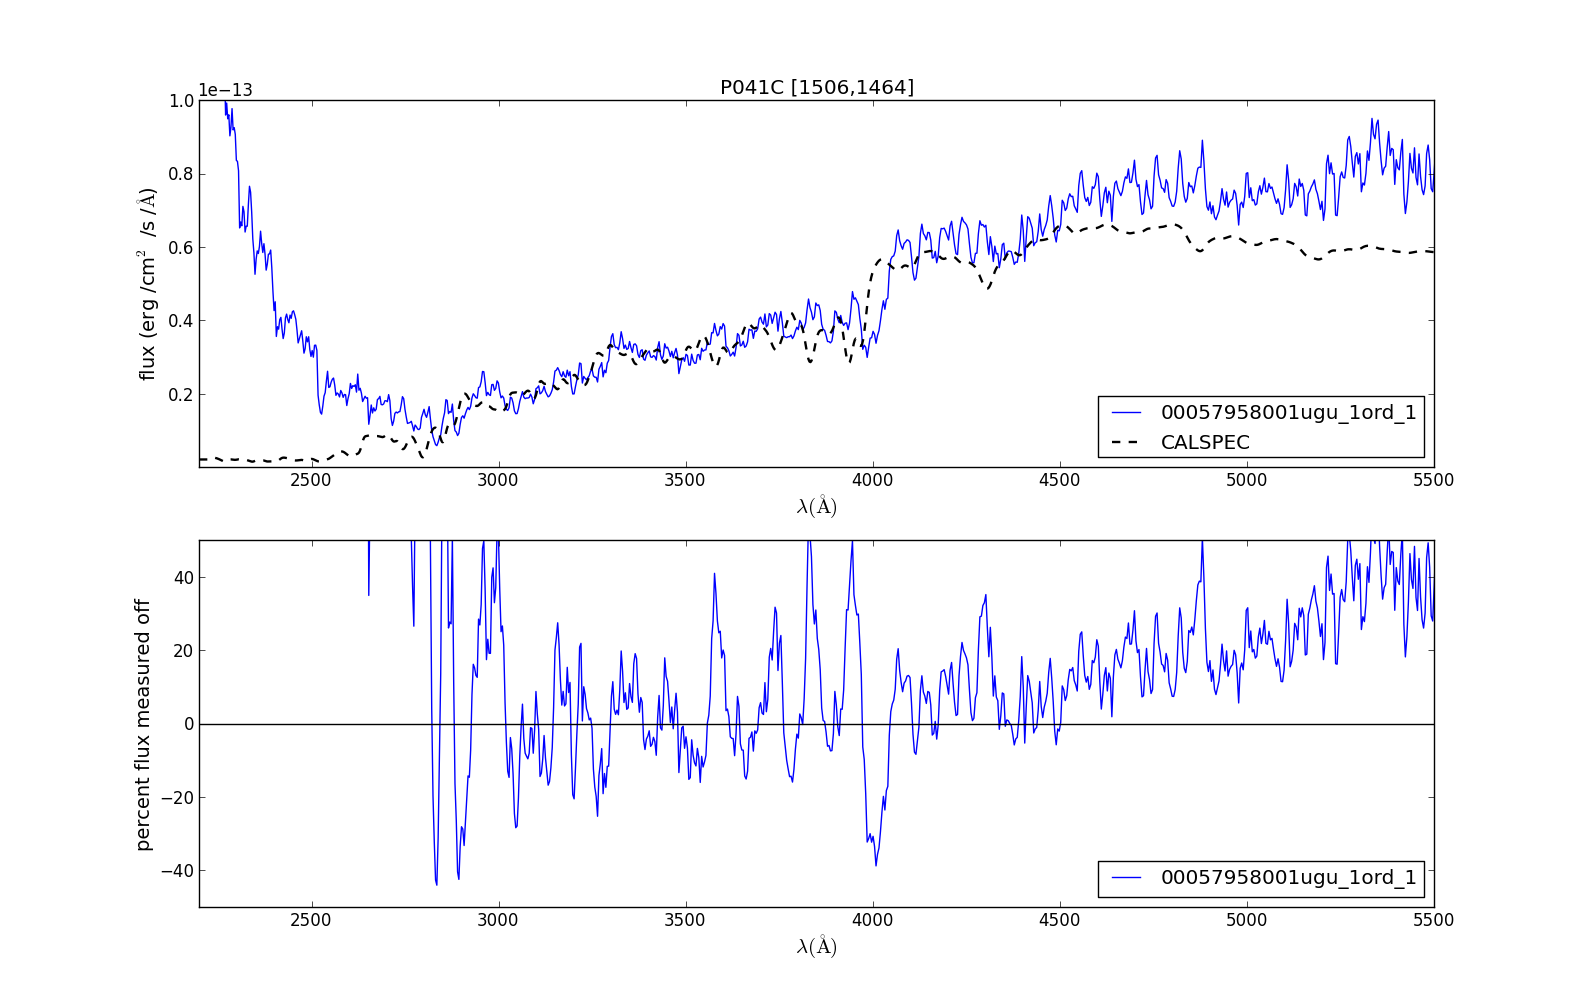
GSPC-P041C Figure 7 This spectrum has its anchor at [1506,1464].
GSPC-P177D spectra (F0 V)
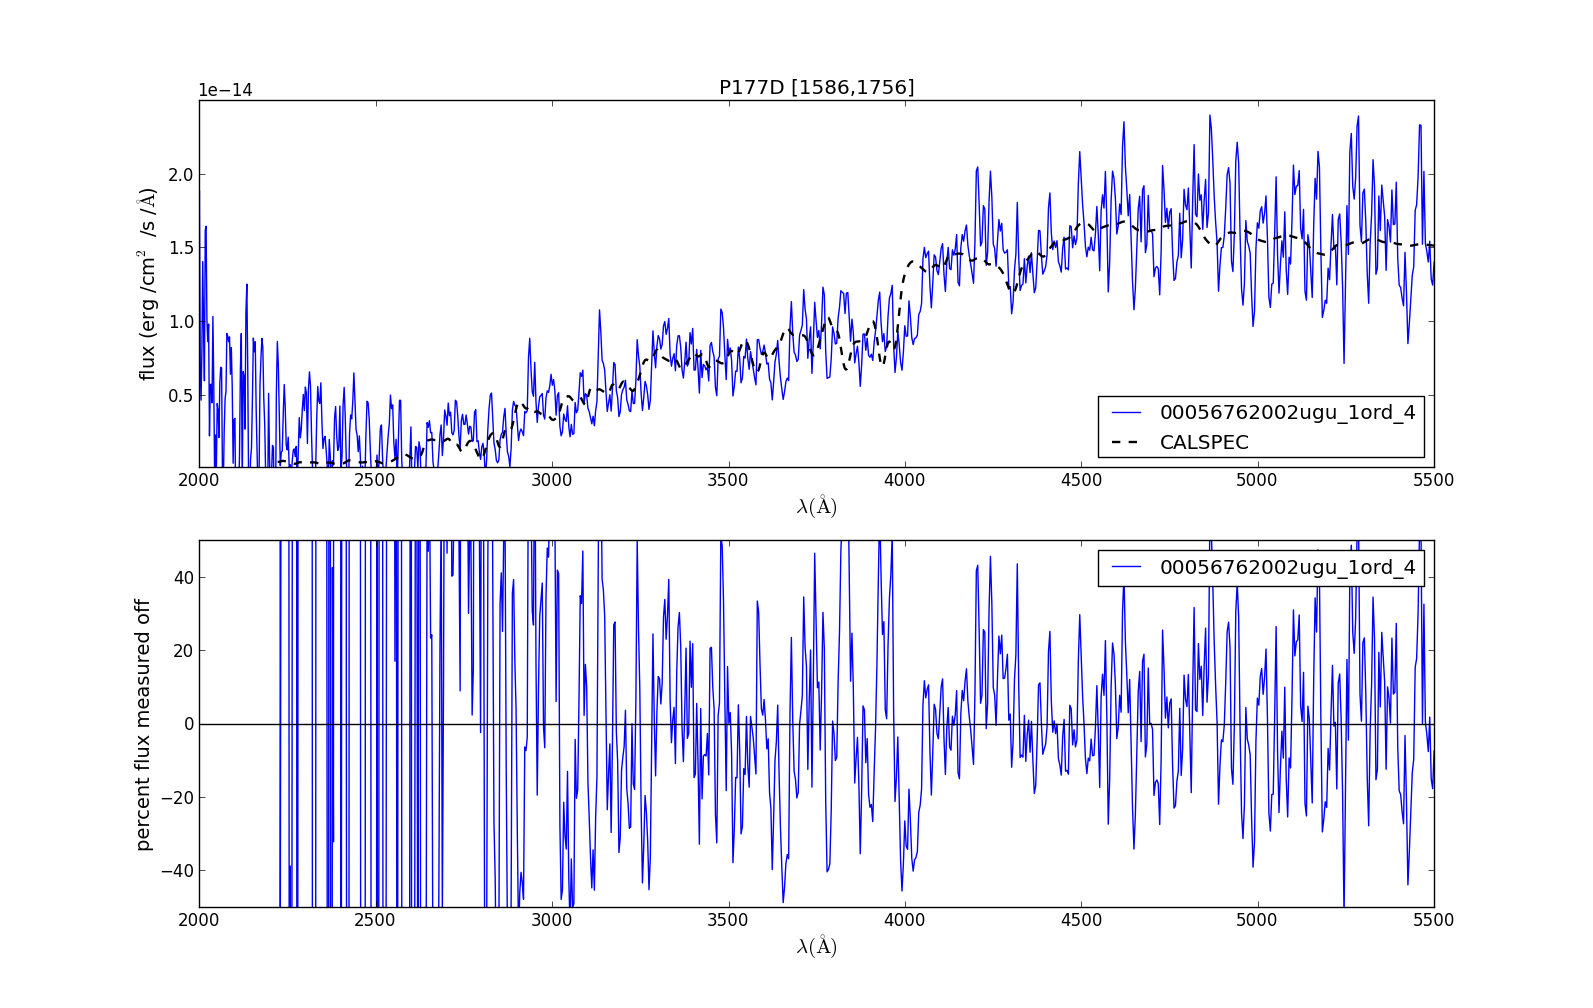
GSPC-P177D Figure 1 This spectrum has its anchor near [1586,1756].
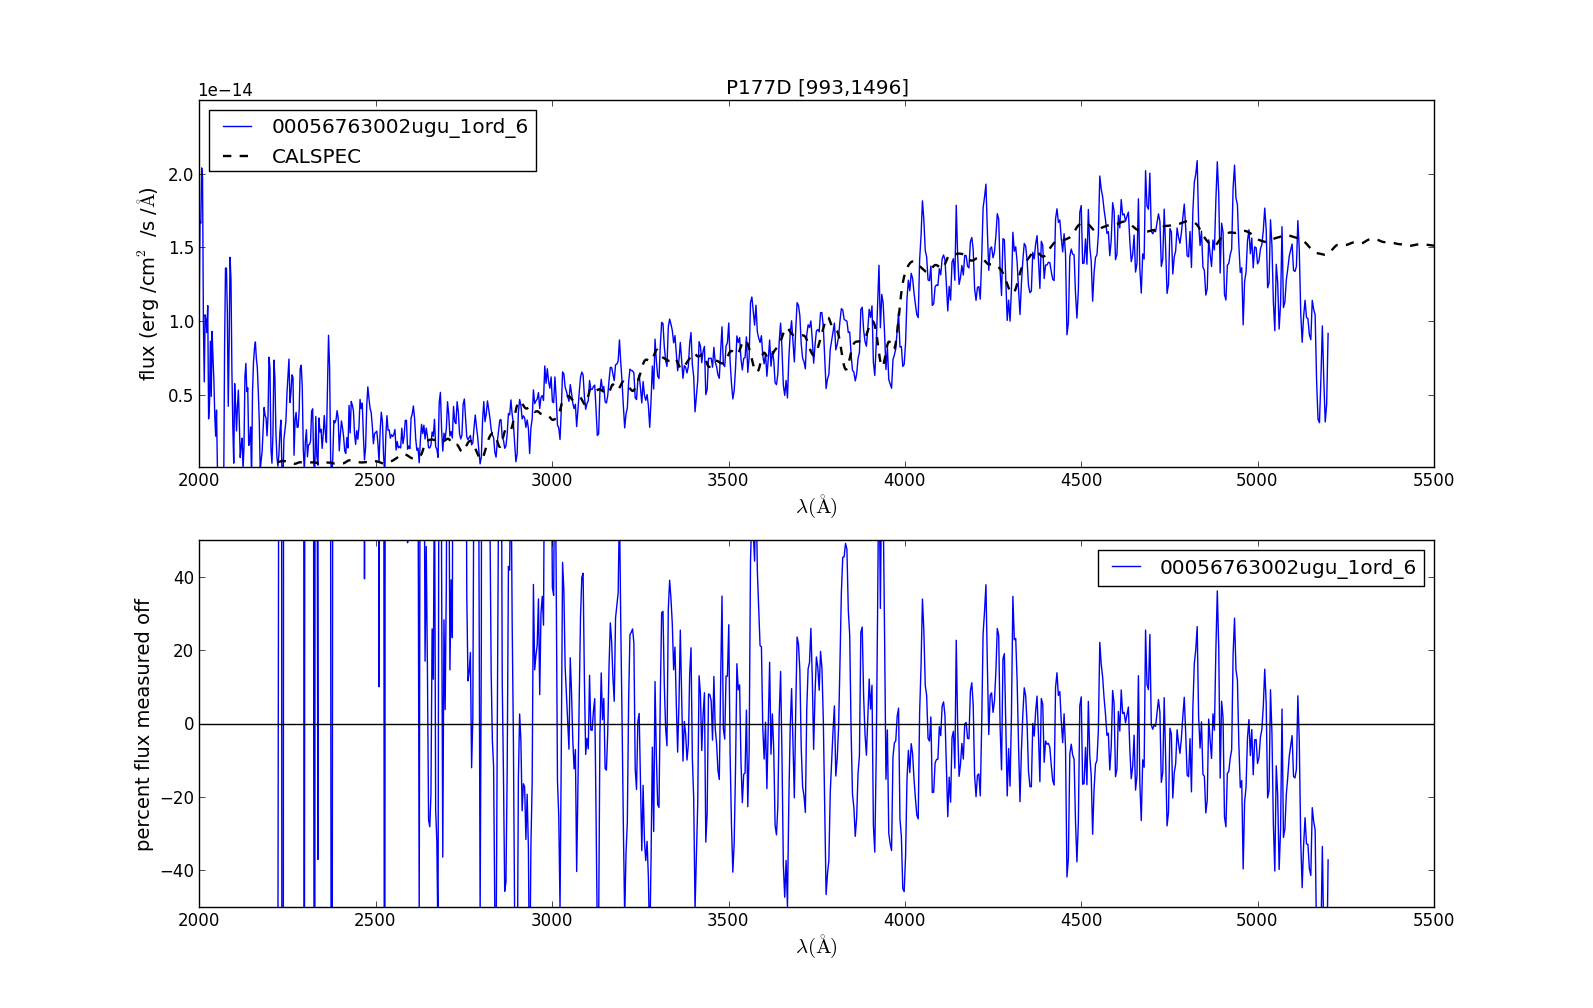
GSPC-P177D Figure 2 This spectrum has it anchor near [993,1496].
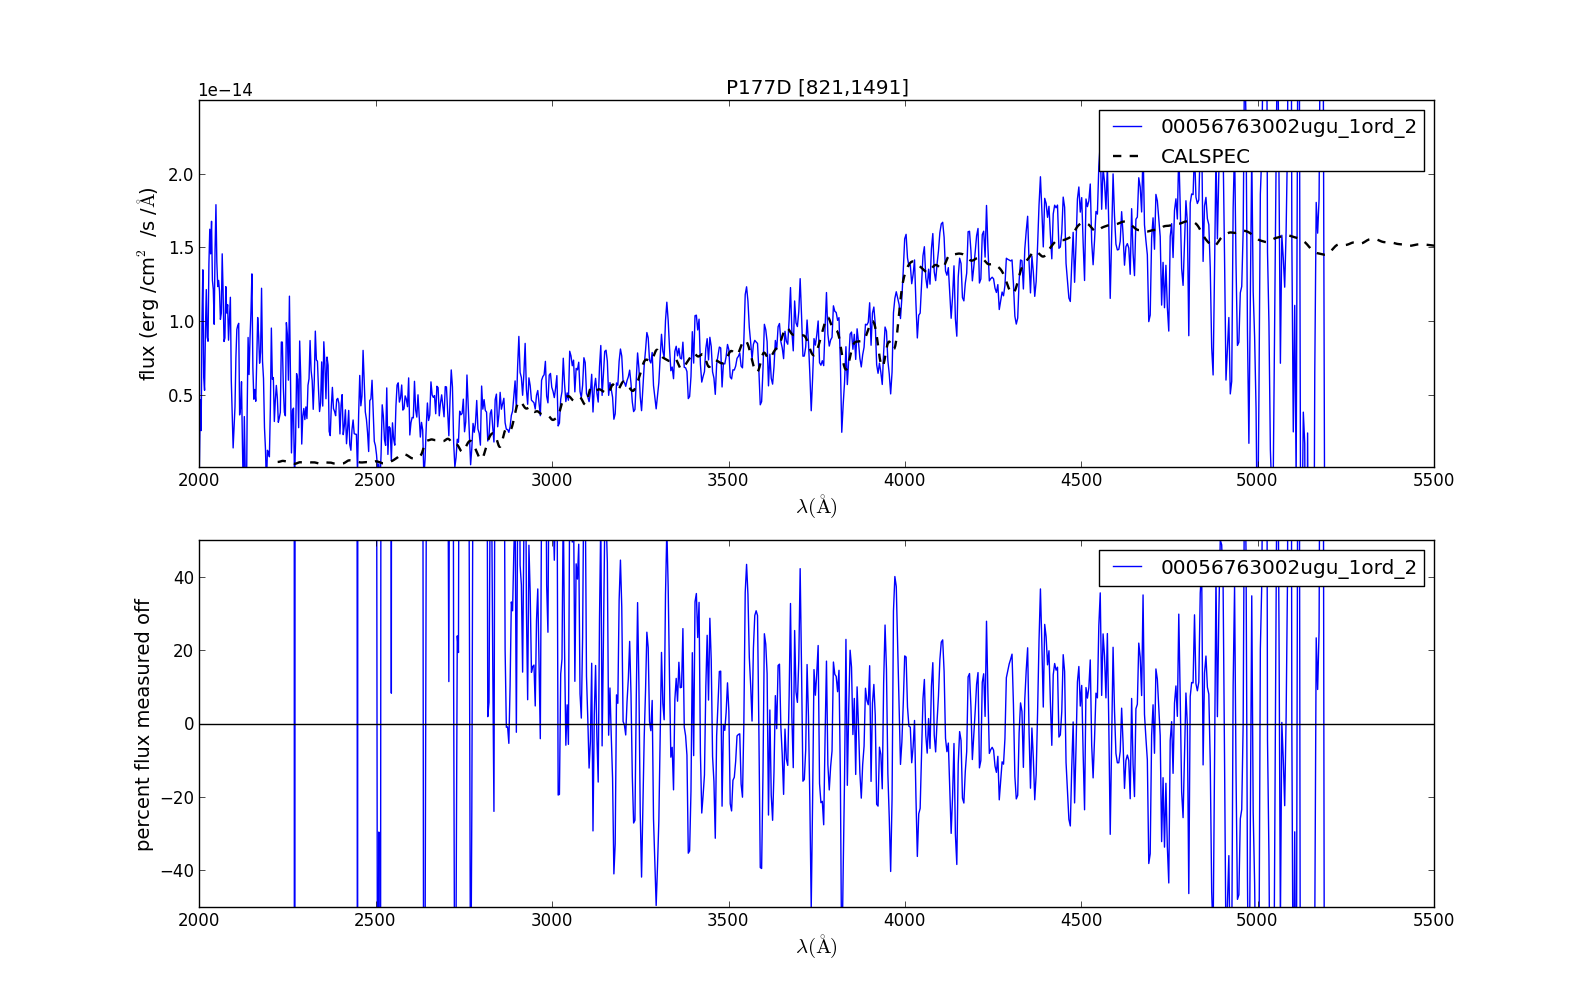
GSPC-P177D Figure 3 This spectrum has its anchor near [821,1491].
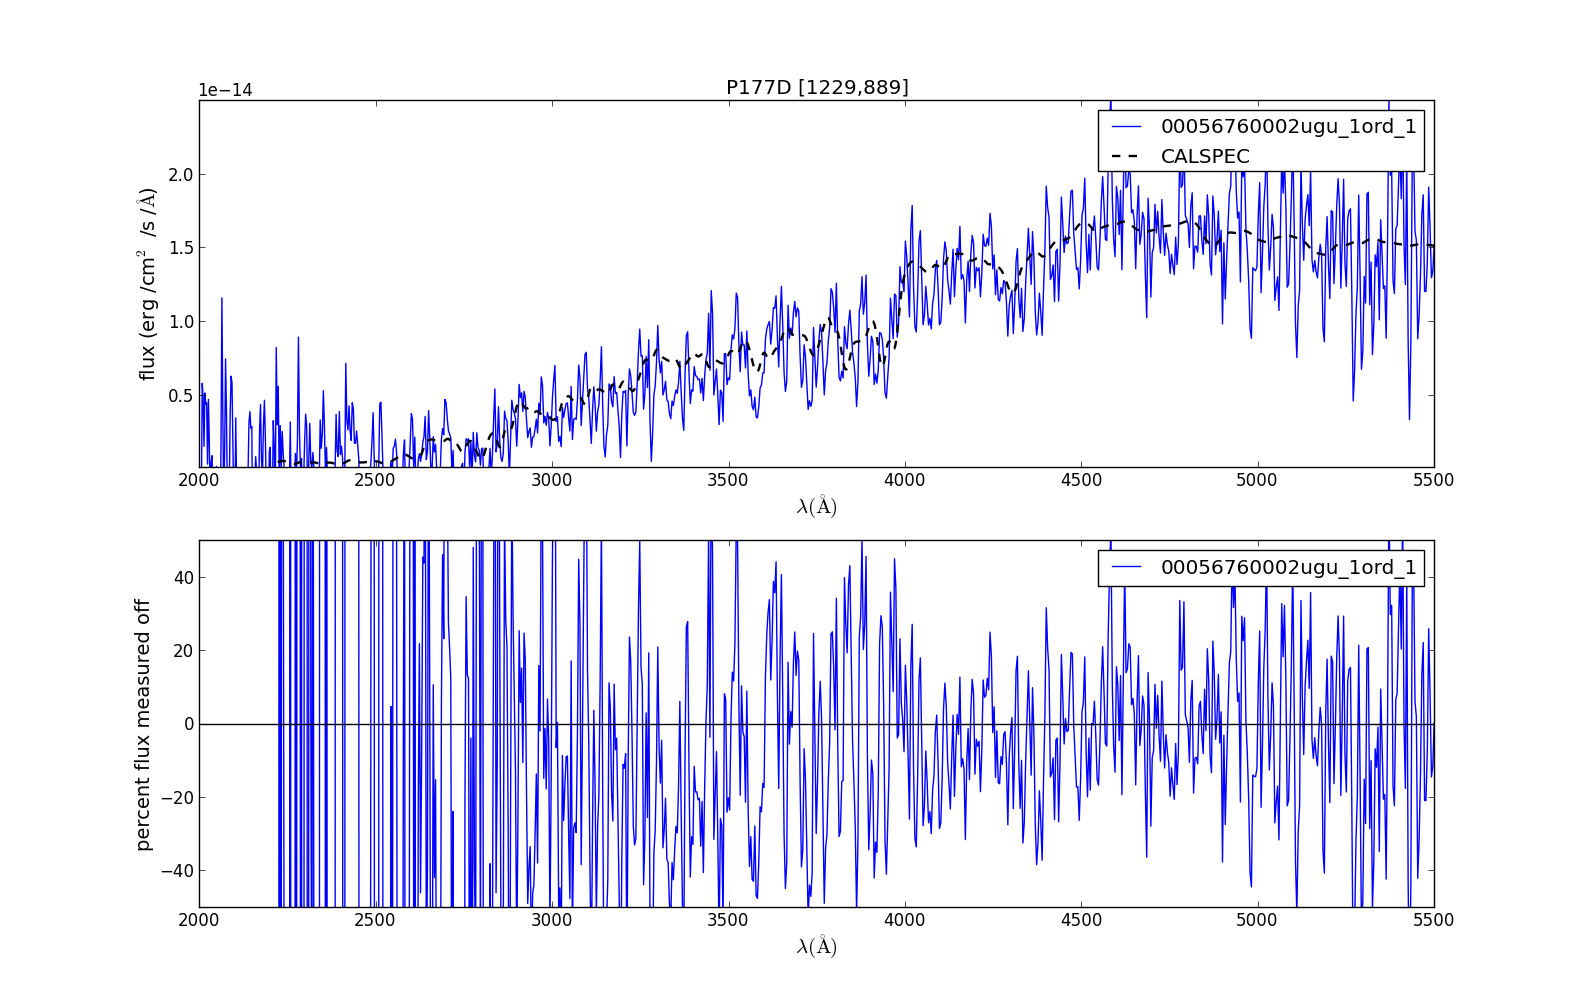
GSPC-P177D Figure 4 This spectrum has its anchor near [1229,889].
WD1657+343 spectra (DA)
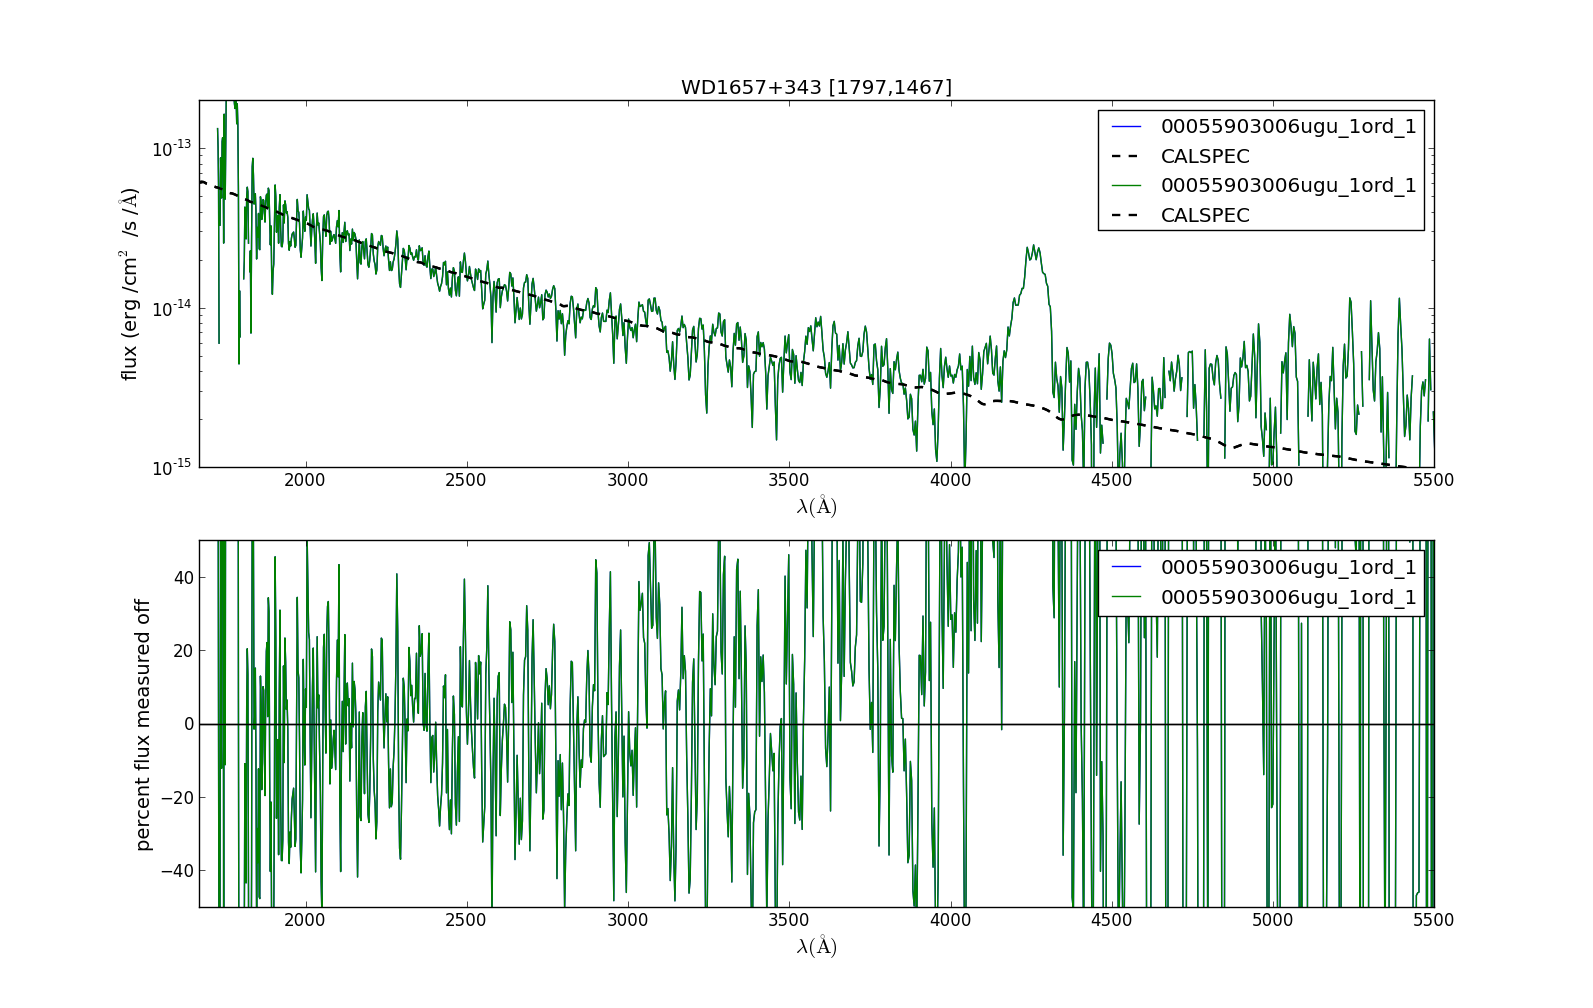
WD1657+343 Figure 1 This spectrum has its anchor near [1797,1467]. A large zeroth order is present contaminating the 4300A region.
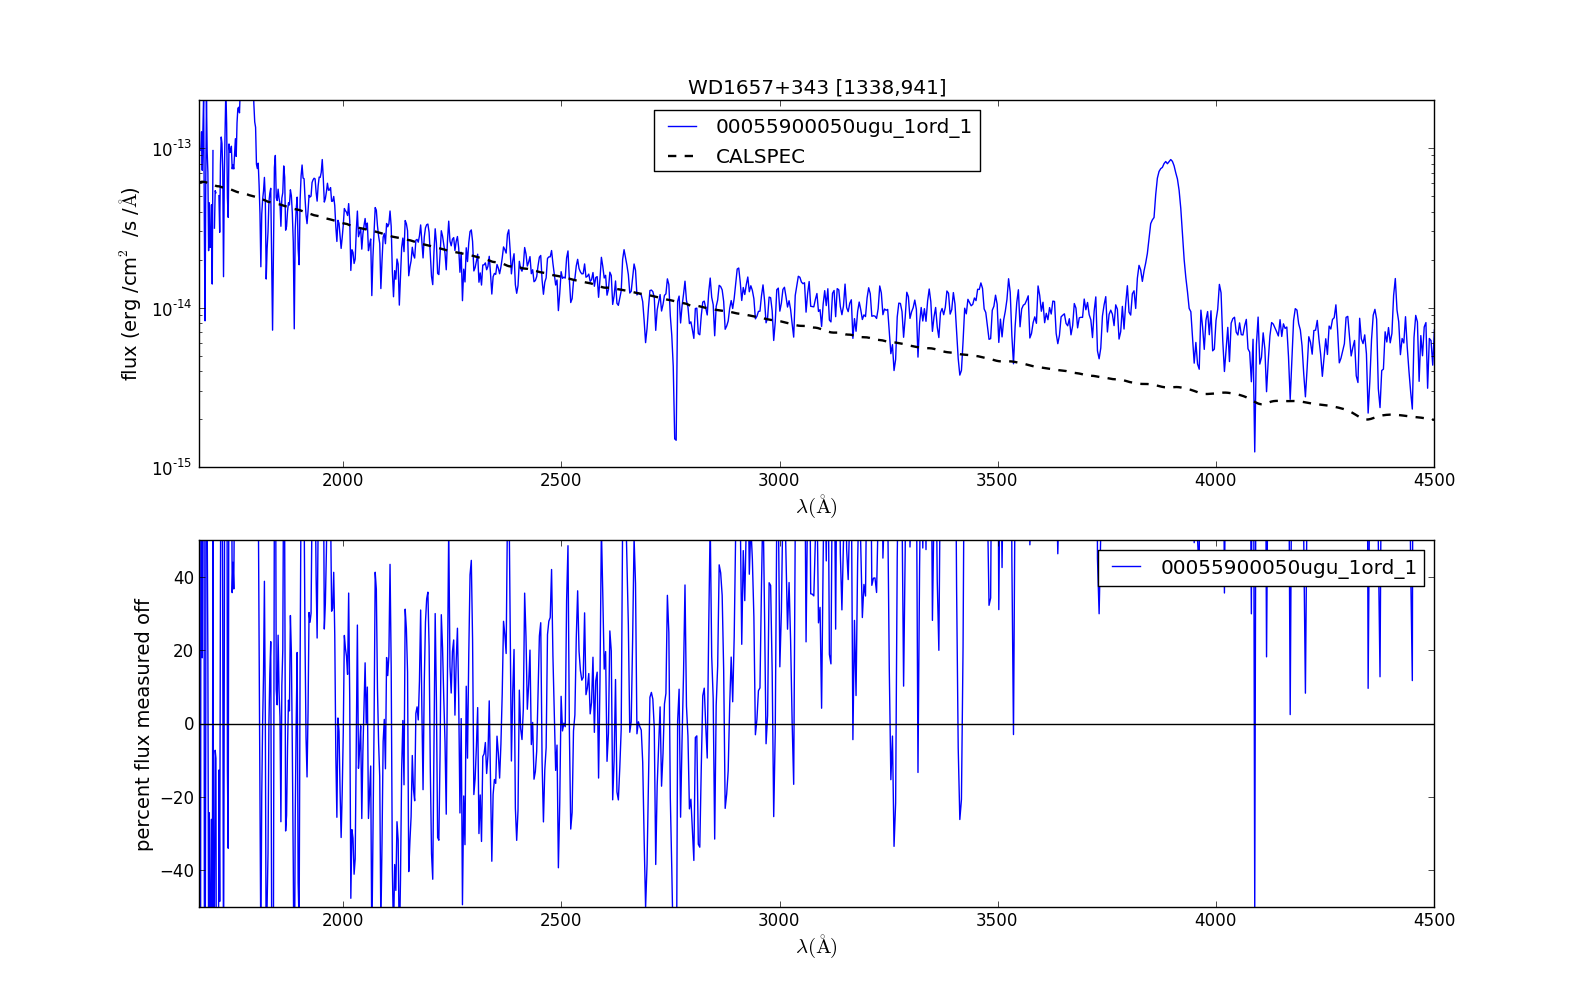
WD1657+343 Figure 2 This spectrum has its anchor near [1338, 941].
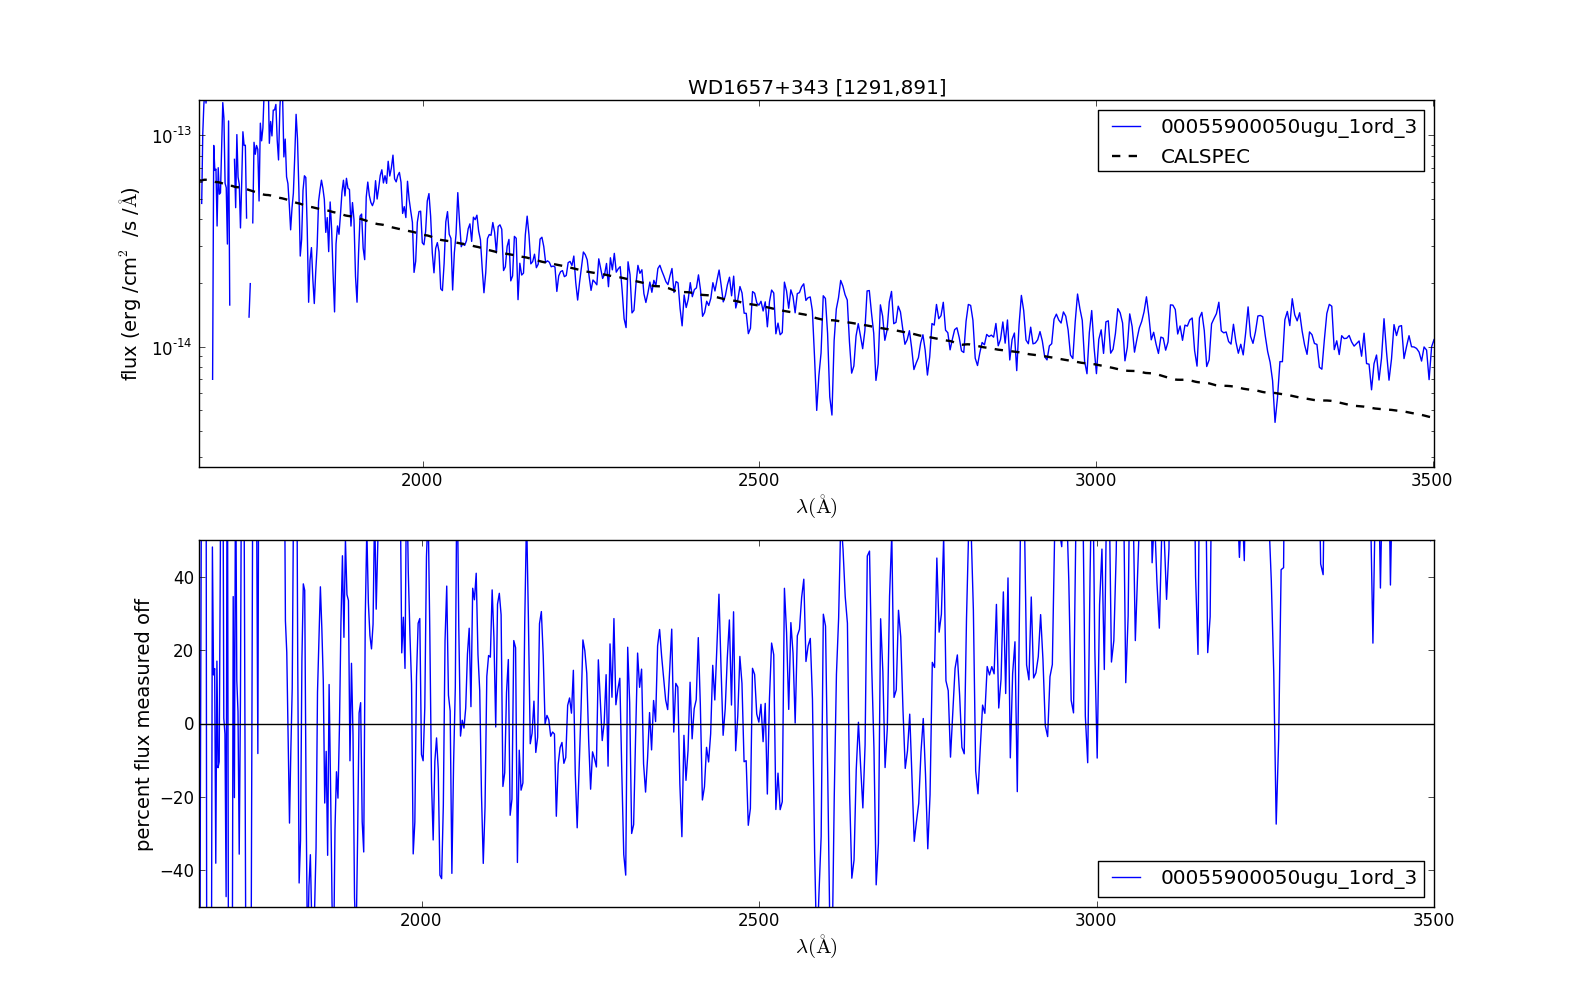
WD1657+343 Figure 3 This spectrum has its anchor near [1291, 891].
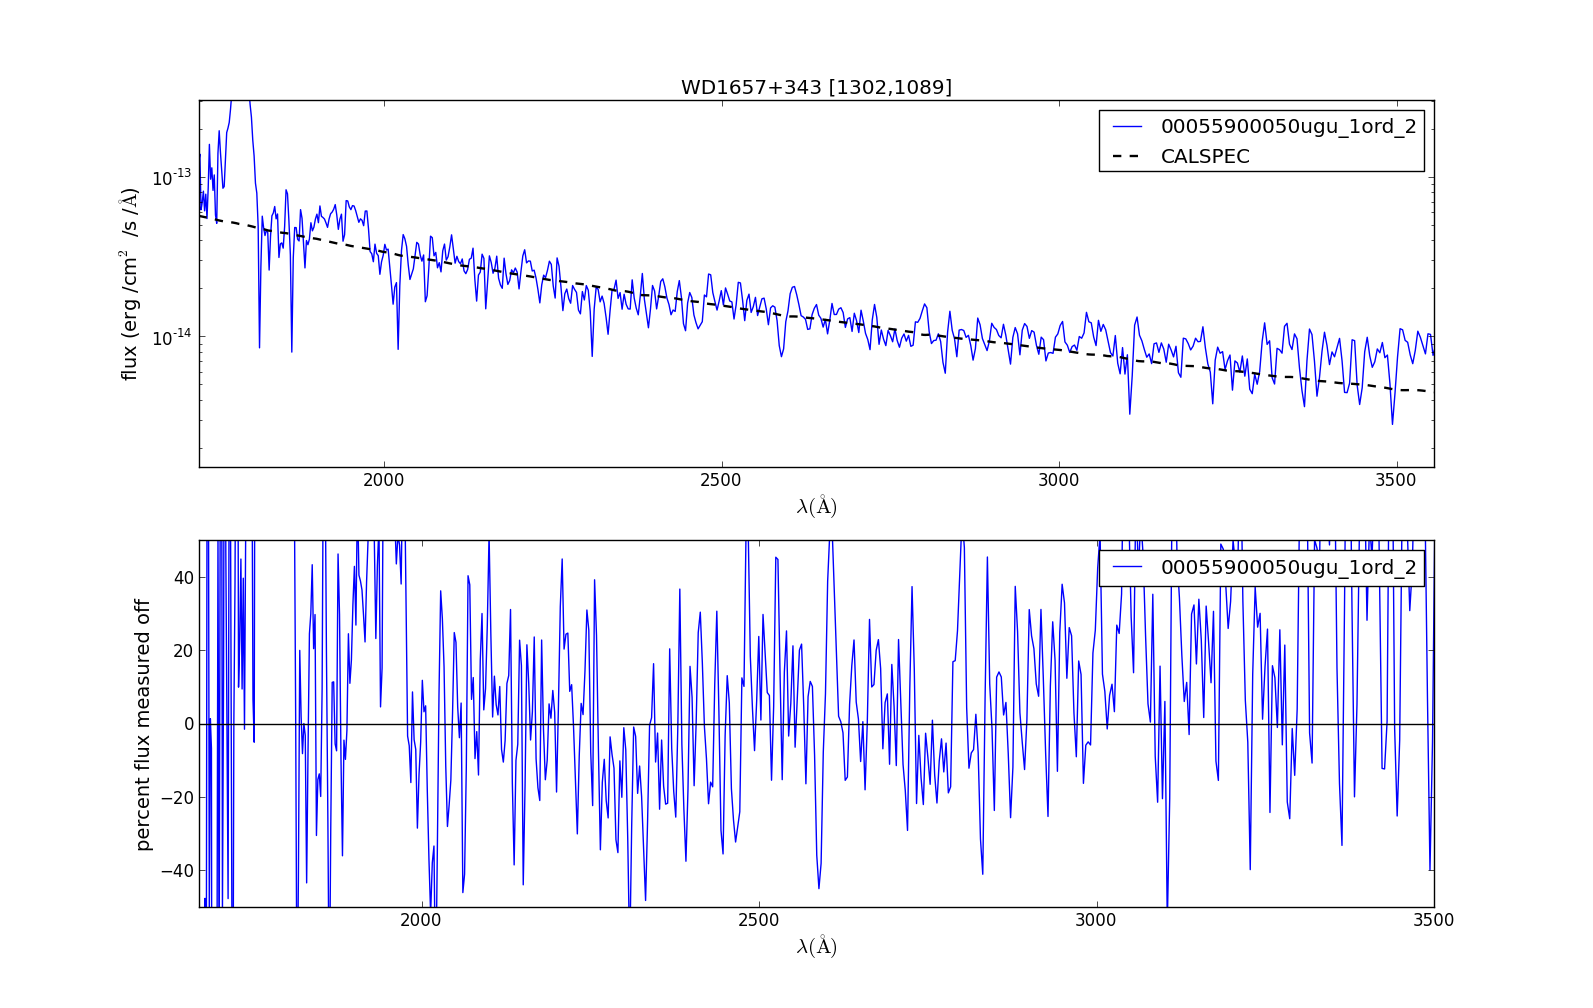
WD1657+343 Figure 4 This spectrum has its anchor near [1302,1082].
WD1057+719 spectra (DA)
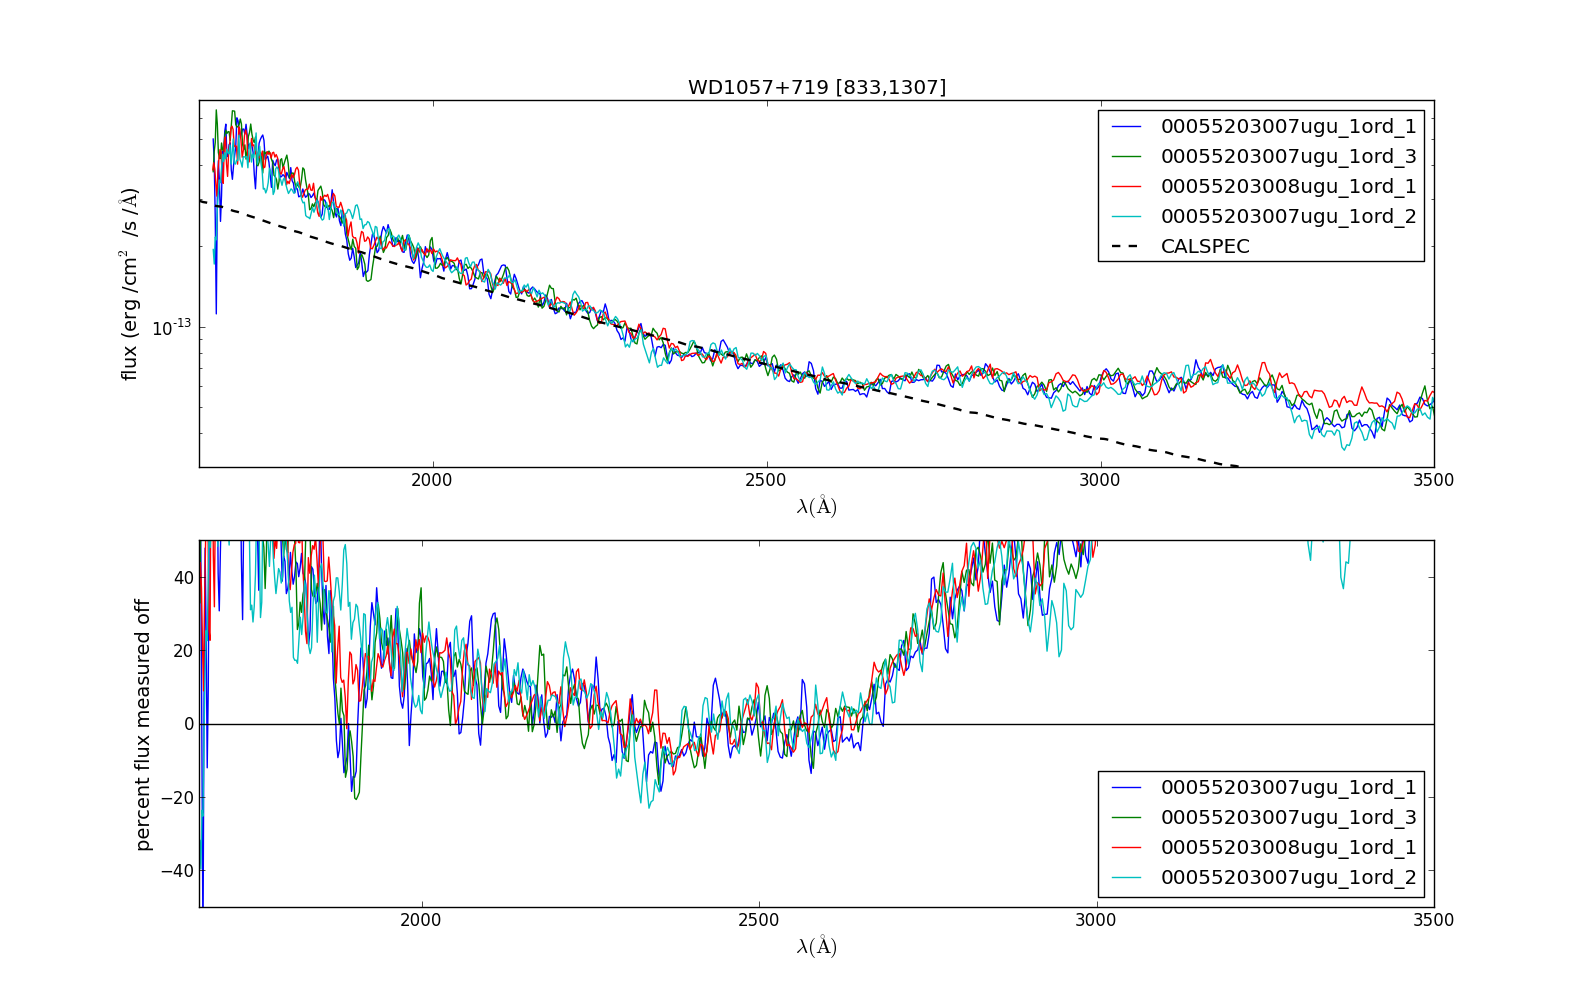
WD1057+719 Figure 1 This spectrum has its anchor near [833,1307]. This spectrum is located near the region of the detector with reduced response. Notice the dip in response near 1800A happens in two locations on the detector and which appear to have a slightly reduced sensitivity. These are only seen very occasionally, and do not have a photometric signature of more than 1%. Very few spectra have been taken at those locations. In the grism, with coincidence loss amplifying differences and background subtraction doing it as well, this appears be more significant than for the UVOT photometry, at least for bright sources. These spots fall close to the spots of reduced photometric sensitivity . The issue is still under investigation.
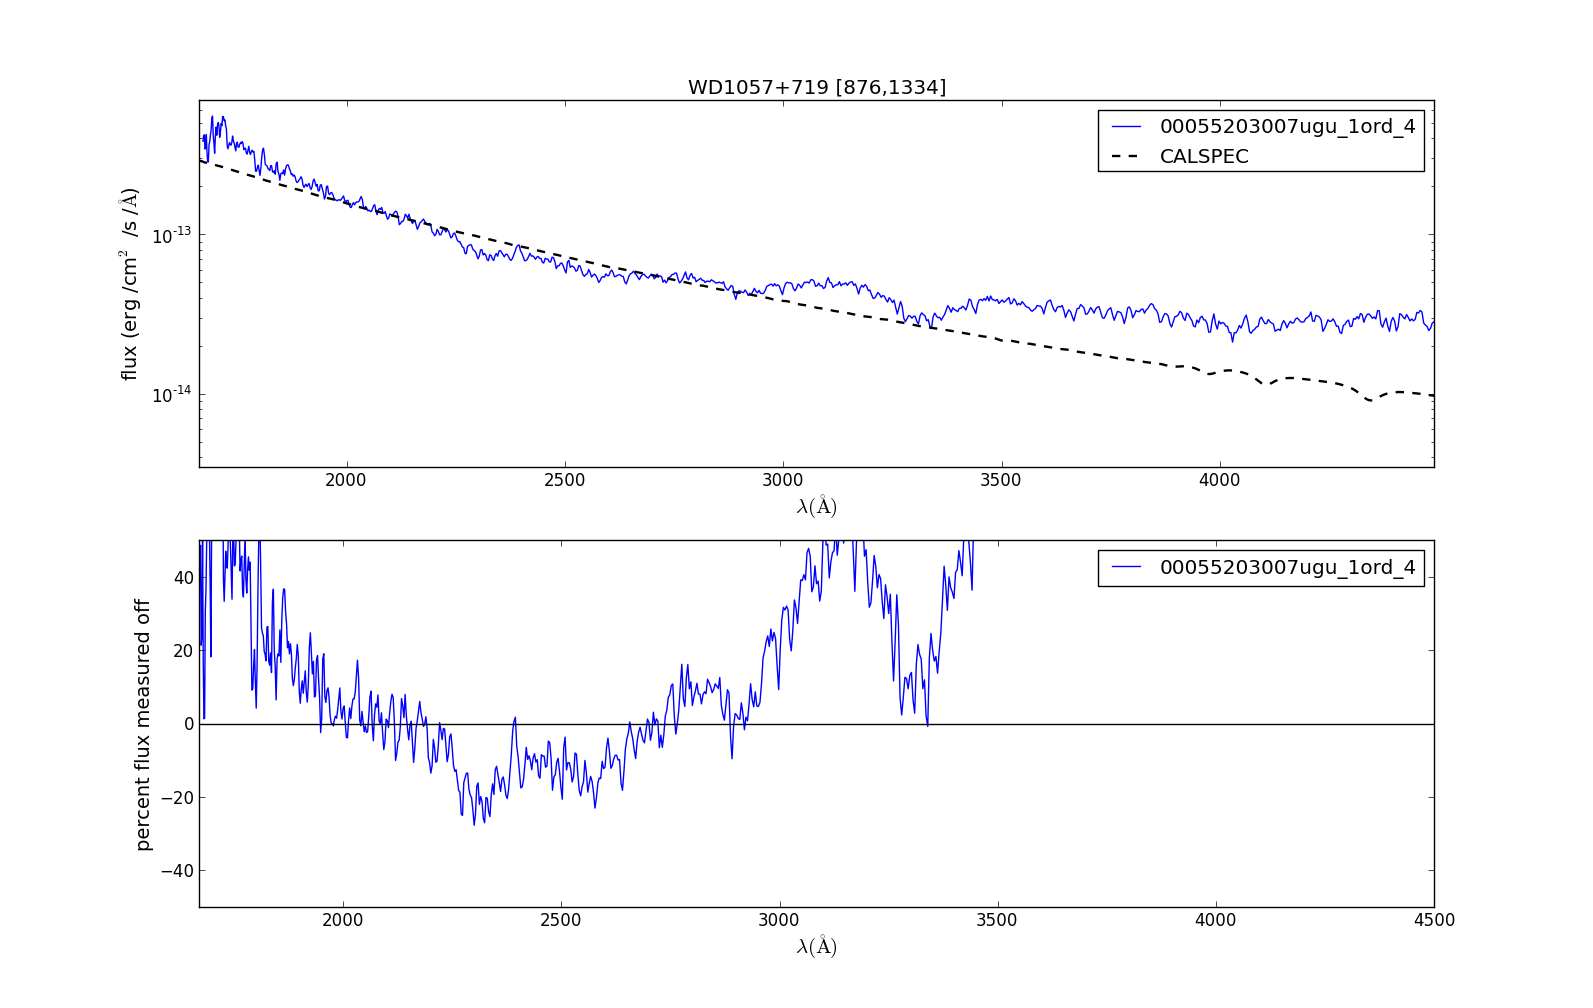
WD1057+719 Figure 2 This spectrum has its anchor near [876,1334]. This spectrum is located near the region of the detector with reduced response.
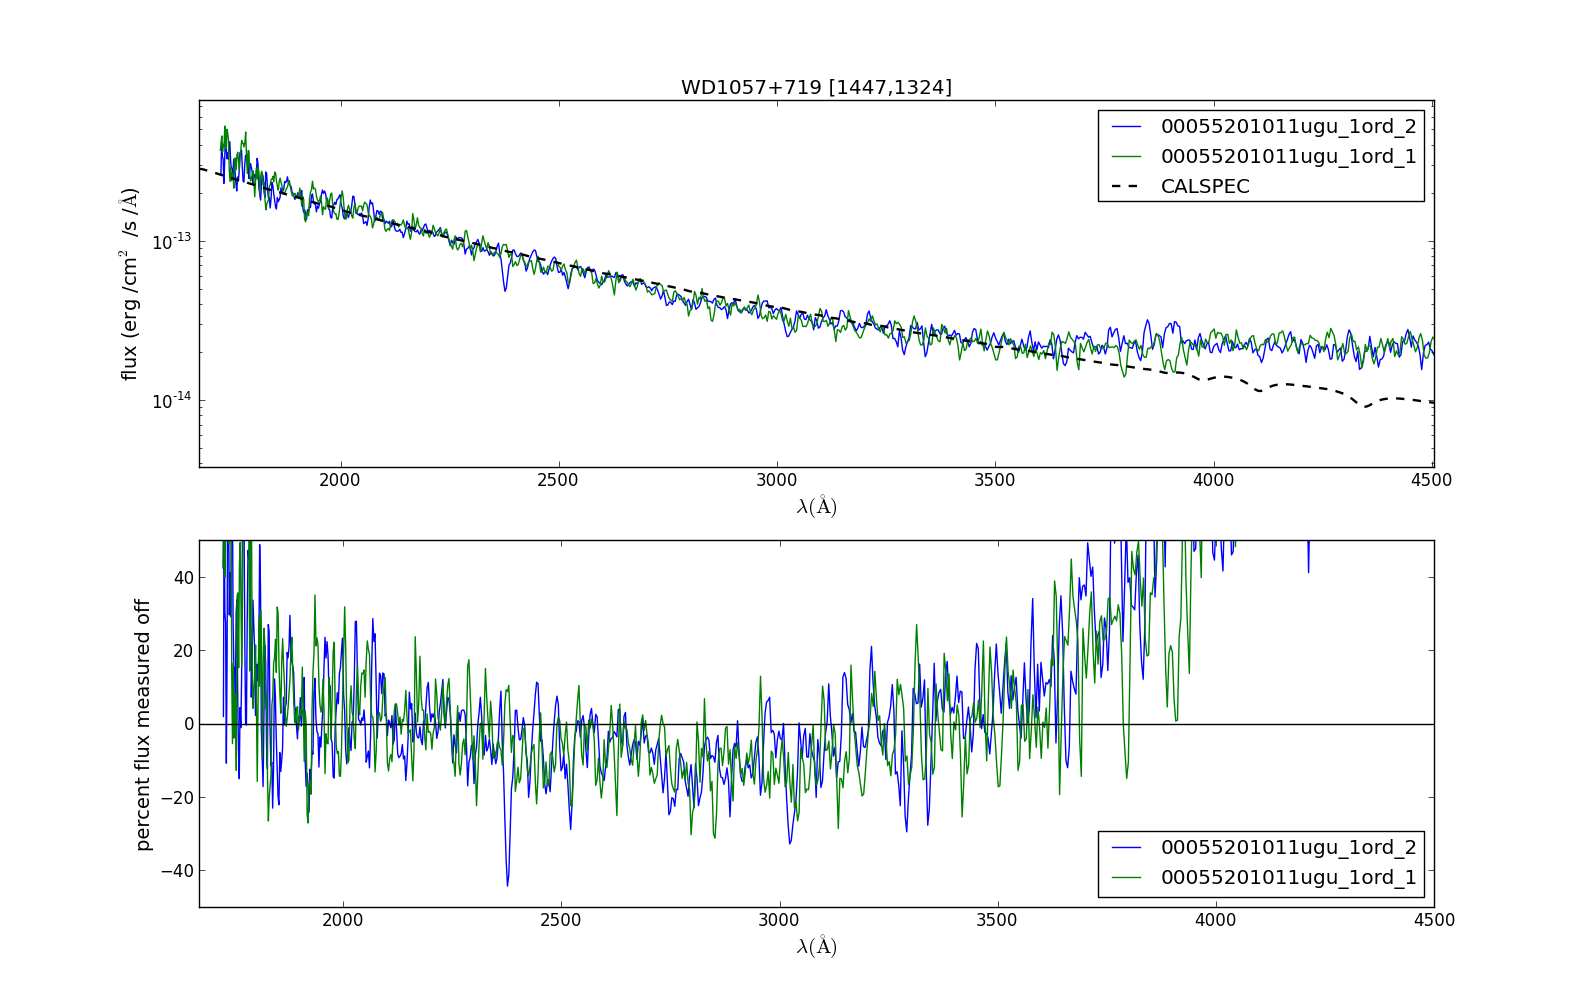
WD1057+719 Figure 3 This spectrum has its anchor near [1447,1324.]
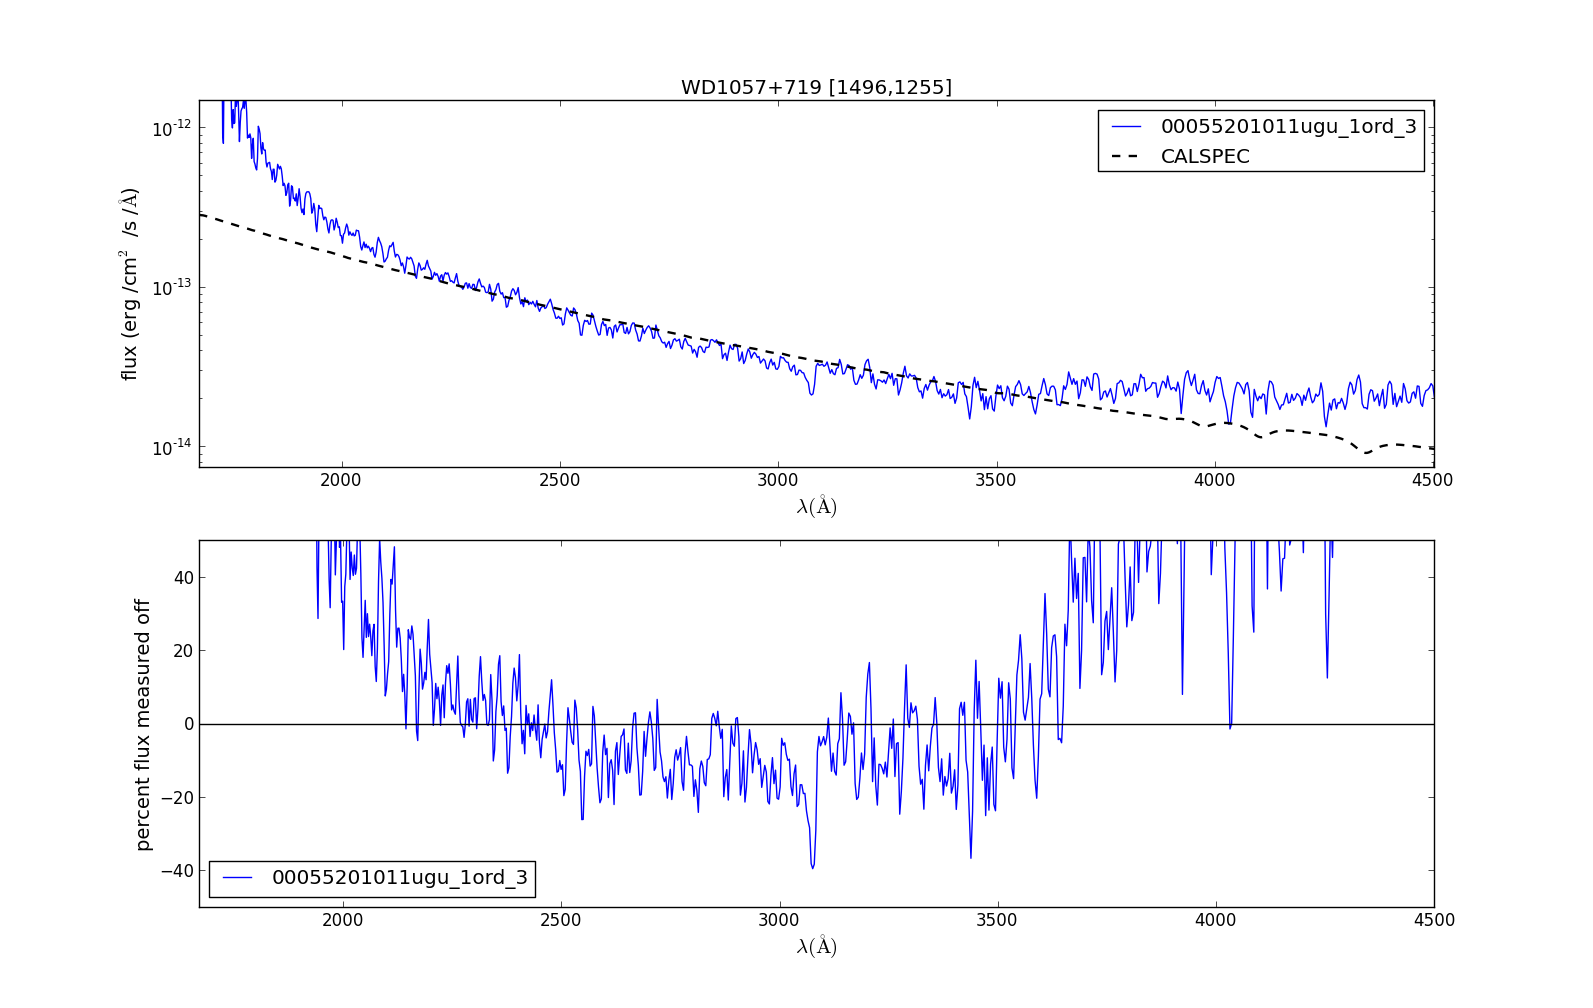
WD1057+719 Figure 4 This spectrum has its anchor near [1496,1255].