
Swift UVOT visual-grism wavelength accuracy in the nominal mode
A Statistical overview of the wavelength calibration accuracy
The errors in the wavelength calibration are summarised on this page, while the verification details using the individual calibration observations are on subsequent pages. The error analysis is based on grism plus lenticular filter observations.
For version 1 a detailed analysis was done taking the new calibration file and reanalysing the data, measuring the line positions, and comparing to the correct positions. For the version 2 (June 2013) update, the anchor positions and dispersion relations from the calibration file were compared to those measured directly from the observations. In 2014 independent sources were used to verify the error in wavelength caused by errors in the anchor position.
The analysis of the 2009 calibration, and the 2013 update, are still valid, as shown by the 2014 verification.
The 2009 wavelength calibration
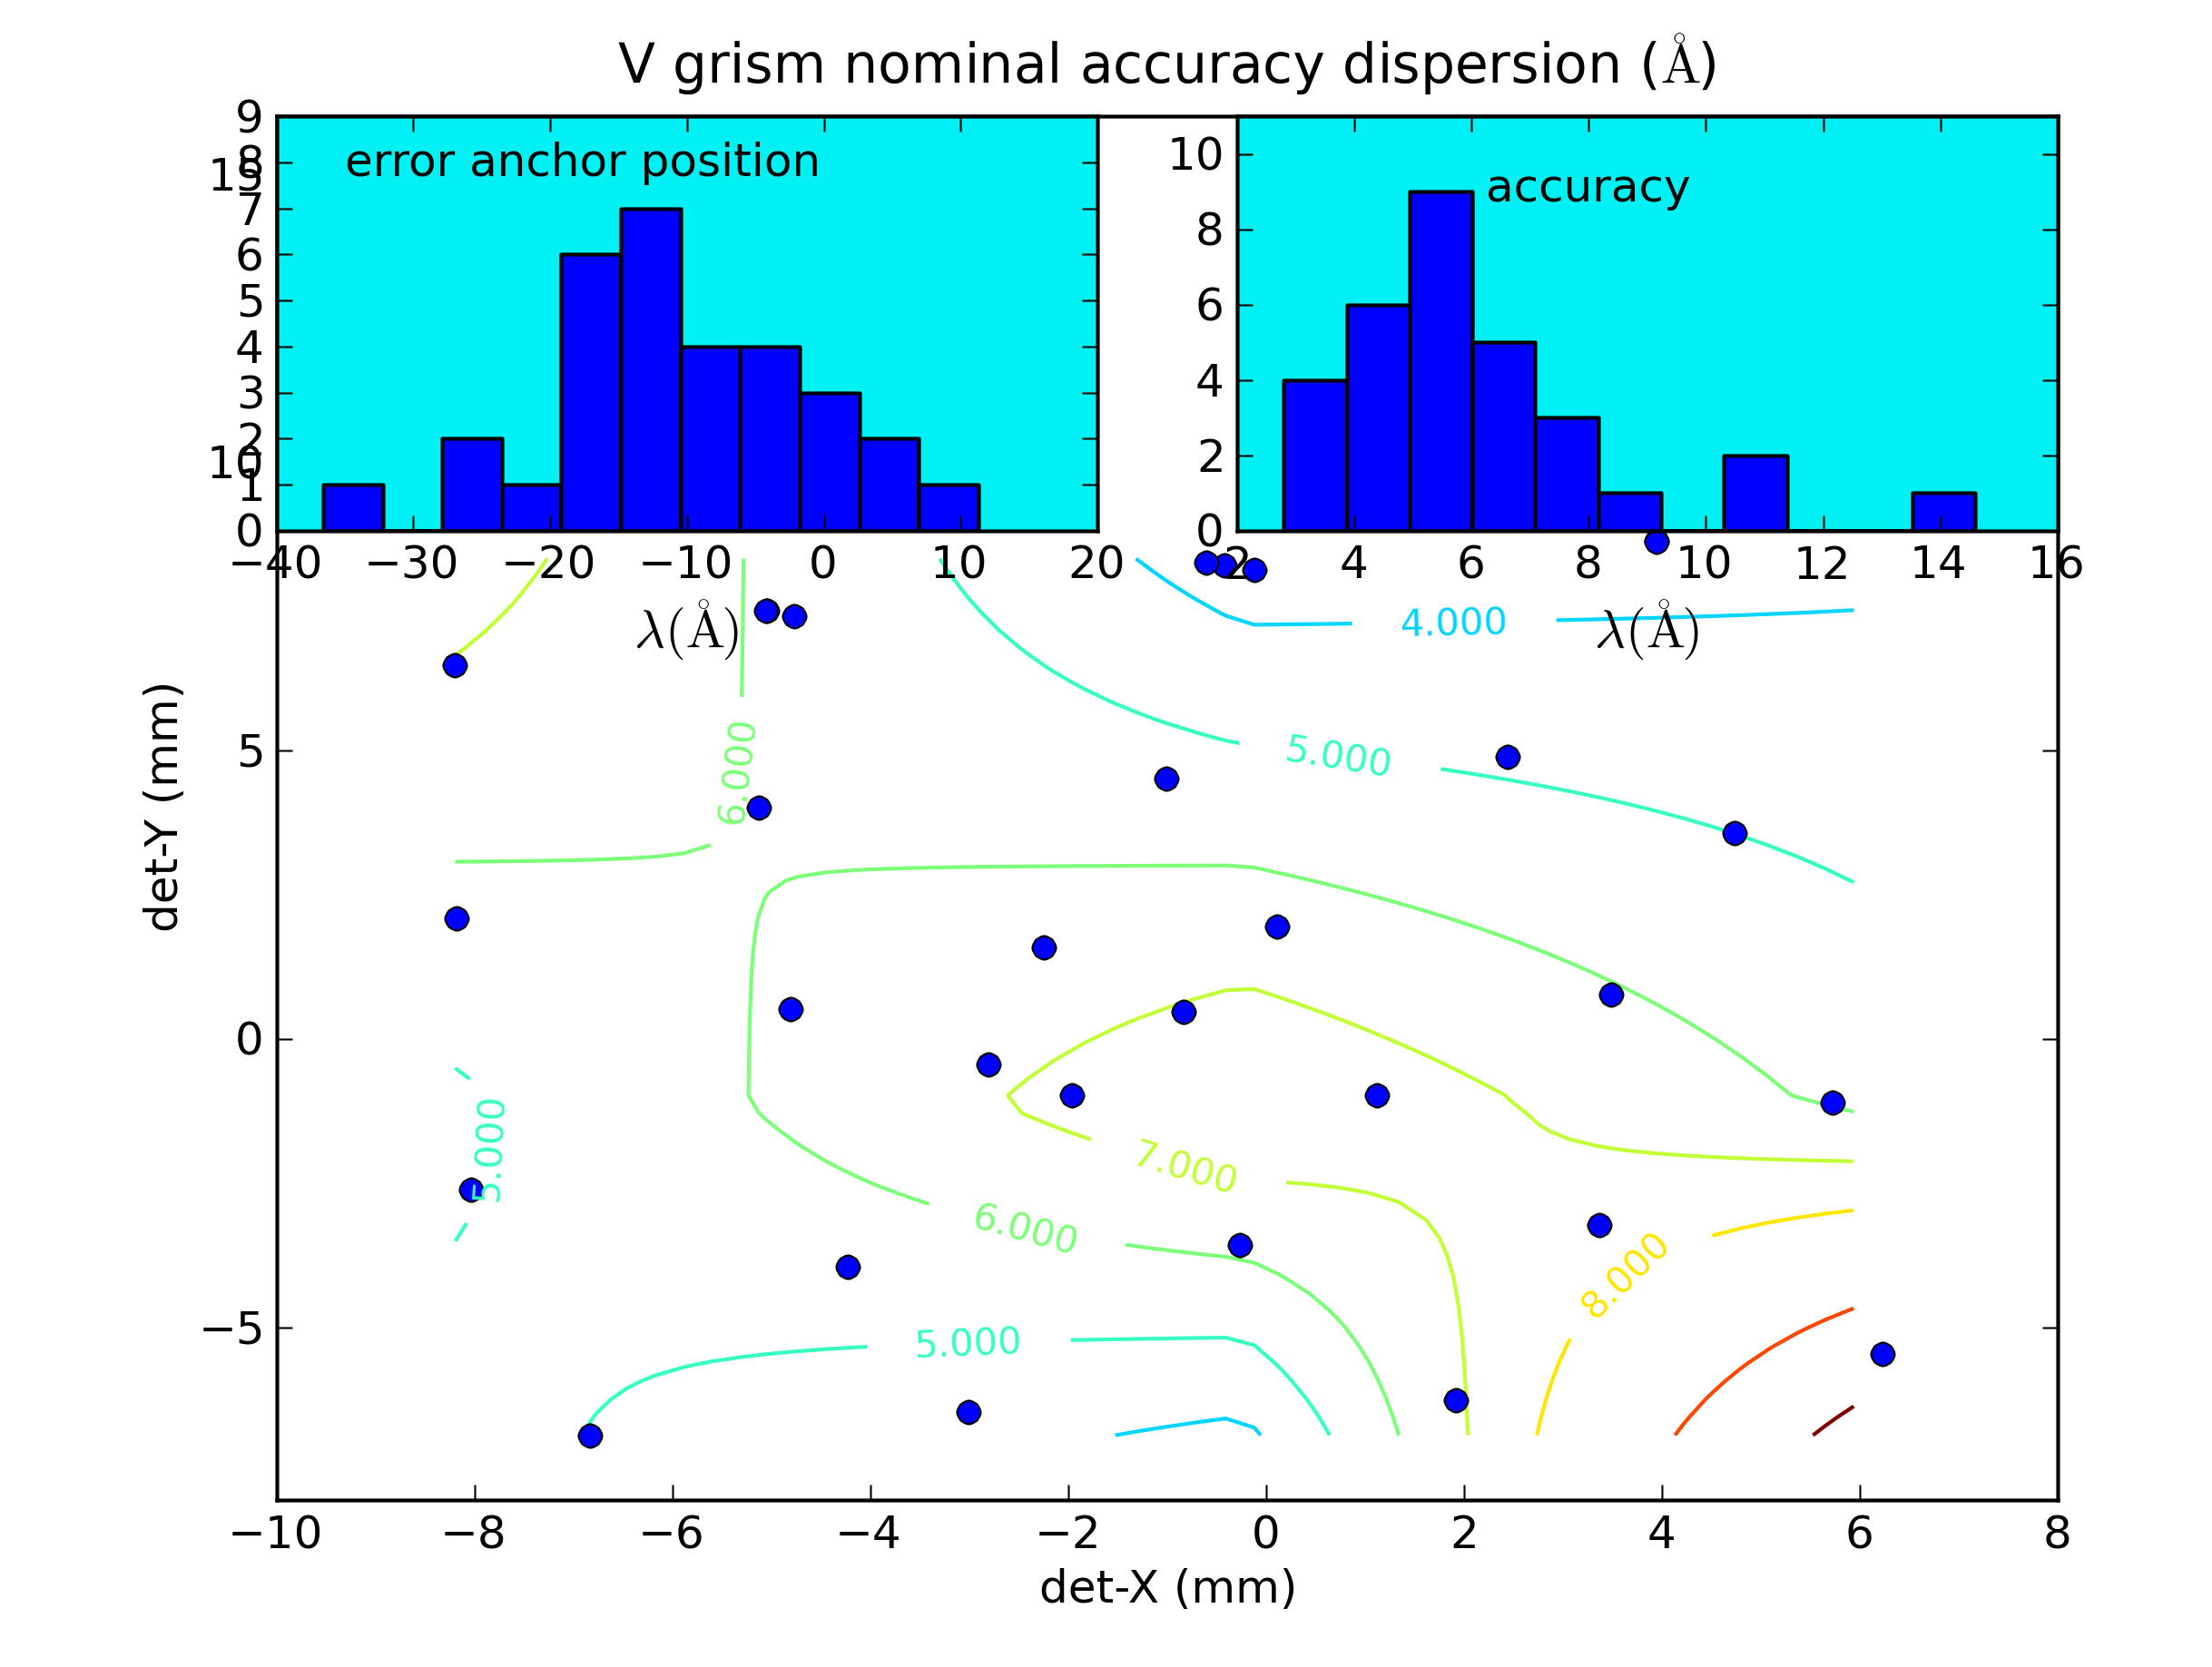
Figure 1: The wavelength scale errors have been split in two parts. The first is the offset of the whole scale due to errors in the anchor position and is shown as a histogram in the inset top left. The second is due to errors in the dispersion and is shown as a histogram in the top right. The data are based on the calibration spectra taken at locations all over the detector. The locations are shown in the main graphs by their anchor positions as blue dots. The error in anchor position is smallest near the default location for placing targets and largest near the edges and are shown as contours labeled with the offsets in Å. The contours are a fit to the accuracy of the dispersion expressed as the RMS error between measured and predicted wavelength for known lines in the spectrum.
The inset in the top left corner shows that at most times the anchor point that was predicted using the source position in the lenticular filters taken just before and after the observation has a systematic offset of 15.9 A. (This offset was corrected for in a final revision of the wavelength calibration file). Disregarding the systematic offset, the anchor position typically falls within 23 A (about 7 pixels) of the mean position. This is sufficient to avoid making misidentifications of the larger spectral features which have a FWHM which is comparable in magnitude. (But see the 2014 verification using independent sources below for the definite number).
Looking at the second inset “accuracy”, and disregarding the systematic wavelength scale offset from the top left inset, wavelengths from the dispersion relation are found to typically fall within 14 Å (about 4 pixels) of the correct value. The “accuracy” is the RMS error of the wavelength as shown in the accuracy plots in more detail, and not the error themselves. The contours in the main figure show the overall variaton of dispersion accuracy over the detector.
To summarize, the main result is, that the RMS error in the wavelengths within a spectrum is typically less than 16 A, which is about 5 pixels, much smaller then the error from inaccurate anchor position of about 33 Å.
Detailed plots of the wavelength accuracy and of the spectra used (2009)
In order to allow better understanding of the capabilities, the data obtained by verification of the calibration spectra with the calibration are provided, as well as plots of the accuracy of fit for the individual observations. See the detailed spectra and accuracy plots.
Recalculation in 2013
In 2013 the line positions and anchor were measured again in each spectrum and stored. The calculated positions were then compared to the observed ones and the errors recalculated, This confirmed the earlier results. It also allows comparison by recalculating errors when program updates produce new calculated line positions, for example after an update of the wavecal file.
The 2014 verification using independent sources
In the flux calibration a different set of sources were used, with white dwarf and solar type star spectra. Several of these lent themselves for checking the wavelength accuracy. Since the main source of error in the wavelengths is due to the inaccuracies in the anchor, the main focus was there.
It became apparent that the whole wavelength scale is not just shifted due to an inaccurate anchor position, but also that such a shift causes a distortion to the wavelenghs due to the non-linear terms in the dispersion (polynomial) relation. However, when a wavelength shift was observed and corrected for, recalculating the wavelengths using the dispersion relation always gave very acceptable fits to the wavelengths of all known lines, consistent with the 2009 analysis.
The anchor accuracy as a wavelength shift
The anchor accuracy was determined for the independent sources in two ways. (1) When a lenticular filter exposure was taken during the grism observation. (2) Only a grism exposure was done (i.e., pre-2008 observations), in which case the anchor position relies on a correct aspect solution with the “uvotgraspcorr ftool”.
The anchor accuracies when using an observation with a lenticular filter exposure included are the same as those found in the 2009 wavelength calibration. However, the spectra which did not have a lenticular filter to determine the anchor showed a complicated behavior with nearly twice the error.
It appears that for some target fields consistent anchor point solutions are found with about the same internal error as when the analysis has the benefit, and uses, a lenticular filter to find the anchor. Then there are some targets that show anchor point solutions that are part of two or three bunches, which appear to occur after an offset or change in roll angle has changed the star field. For one source there are many such bunches, and the impression is that this is a systematic problem in finding a good aspect solution for the grism image using the “uvotgraspcorr ftool”.
A further analysis of this issue will be undertaken, and hopefully we find the bug and can bring the anchor accuracy of all exposures to the same level.
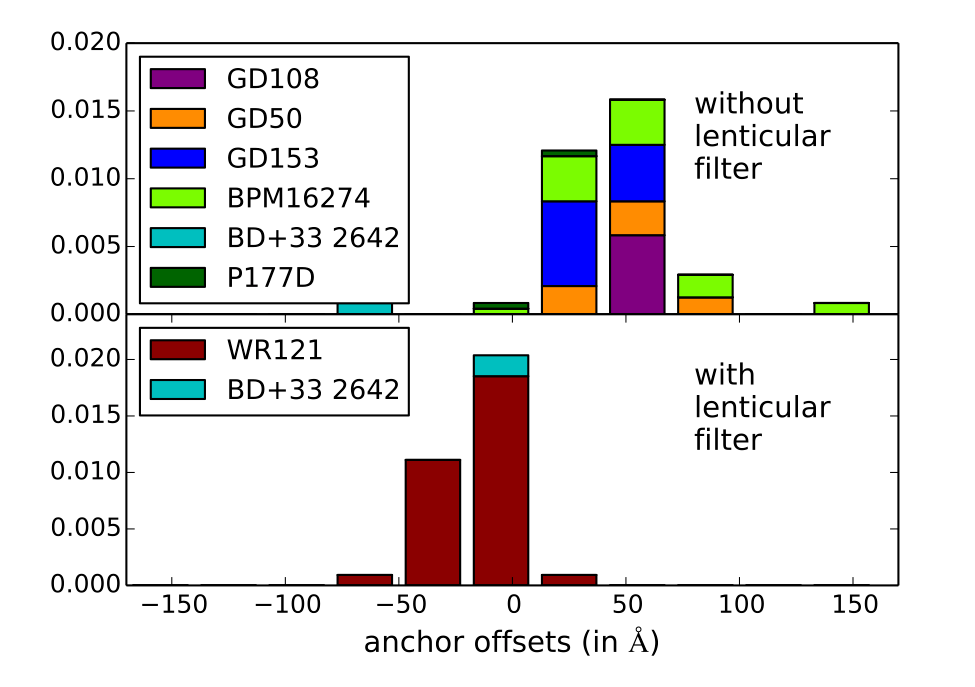
Figure 2: 2014 wavecal verification: This shows the 2014 verification of the wavelength shift due to anchor inaccuracy. It can be seen that in the absence of a lenticular filter the wavelenghs are shifted much more, and that the offset depends on the source.
Technical Documents
- Swift UVOT Calibration report. Zemax optical models for the UV-Grism study: Zemax pixel scale factor and positioning. MSSL 2008.
- Swift UVOT calibration report: Zemax optical models for the UV grism study. Second order wavelength scale for sources near the axis.