
| Preliminary results from a simulated Multi-Order imaging Spectrograph |
|---|
A qualitative understanding of the observed region can be obtained by comparison of the outer two orders. Because they disperse λ in different directions, dynamic features in one of the outer orders will look physically different to the other. Even a simple subtraction can yield information.
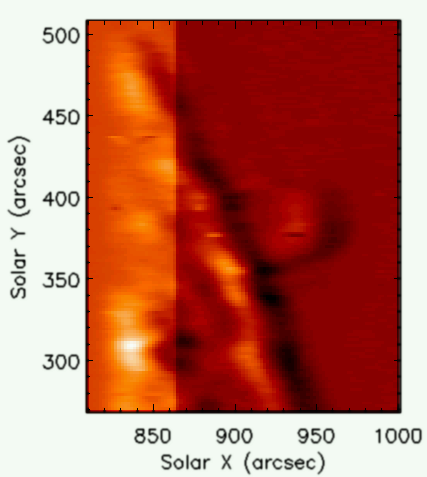
Figure 3: A simple subtraction of outer two orders reveals an indication of flows in the AR loop.
Advanced analysis involves taking the three observed orders and passing them through a Fourier Backprojection algorithm, which employs the Fourier Slice theorem to relate the projections observed at the three orders back to an entire λ,x,y data cube. From the reconstructed data cube, a quantitative comparison can be made by producing original and reconstructed dopplergrams, as shown below.
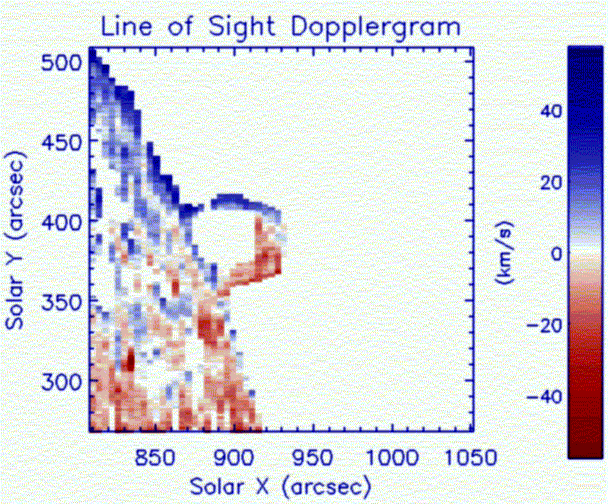
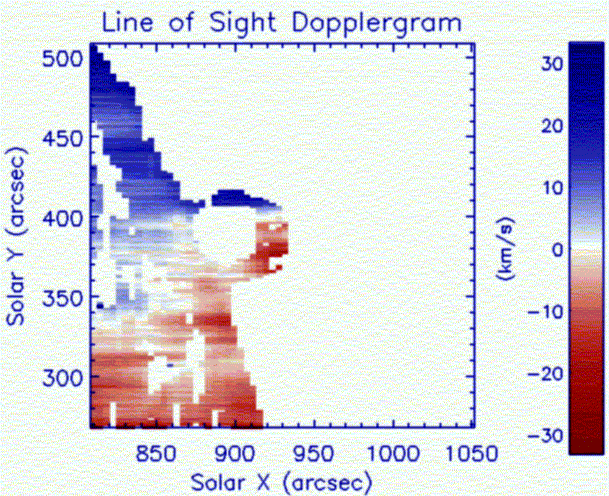
Figure 4: Original dopplergram (left) and reconstructed by Fourier Backprojection (right)
Initial results show a reconstruction of
velocities with an estimated error of ±15 km/s. This is expected to be
improved upon with more advanced deconvolution techniques.