
Data Processing: Quality Flags
The XMM-OM data reduction pipeline performs a series of diagnostic tests on each source table in order to flag potential quality issues. The results of these tests are stored in a Boolean sense (i.e passed or failed) within an integer number stored in the FILTER_QUALITY_FLAG catalogue columns. The integer number is simply the sum of all individual flags ΣFi, where i = 0,1,2,..,8. The meaning of each bit or flag is summarized in Table 1. In this section we describe each quality test in detail. The tests often contain criteria which may appear arbitrary, but these have been converged upon after manual trials and screening of 1000s of individual OM images.
| i | Fi | Description |
|---|---|---|
| 0 | 1 | Source lies over a cosmetic detector defect (bad pixel) |
| 1 | 2 | Source lies potentially over a readout streak originating from a bright field object |
| 2 | 4 | Source lies potentially over a smoke ring originating from a bright field object |
| 3 | 8 | Source lies potentially over a diffraction spike originating from a bright field object |
| 4 | 16 | Bright source surrounded by coincidence-loss-induced modulo-8 pattern |
| 5 | 32 | Source lies within the central image, where the background is enhanced by scattered light |
| 6 | 64 | Potential source confusion with a bright object detected nearby |
| 7 | 128 | Source aperture lies across the outer edge of a raw detector image |
| 8 | 256 | A point source which lies within, or partially-within, an extended source |
| 9 | 512 | Source is too compact (inconsistent with the PSF) |
 |
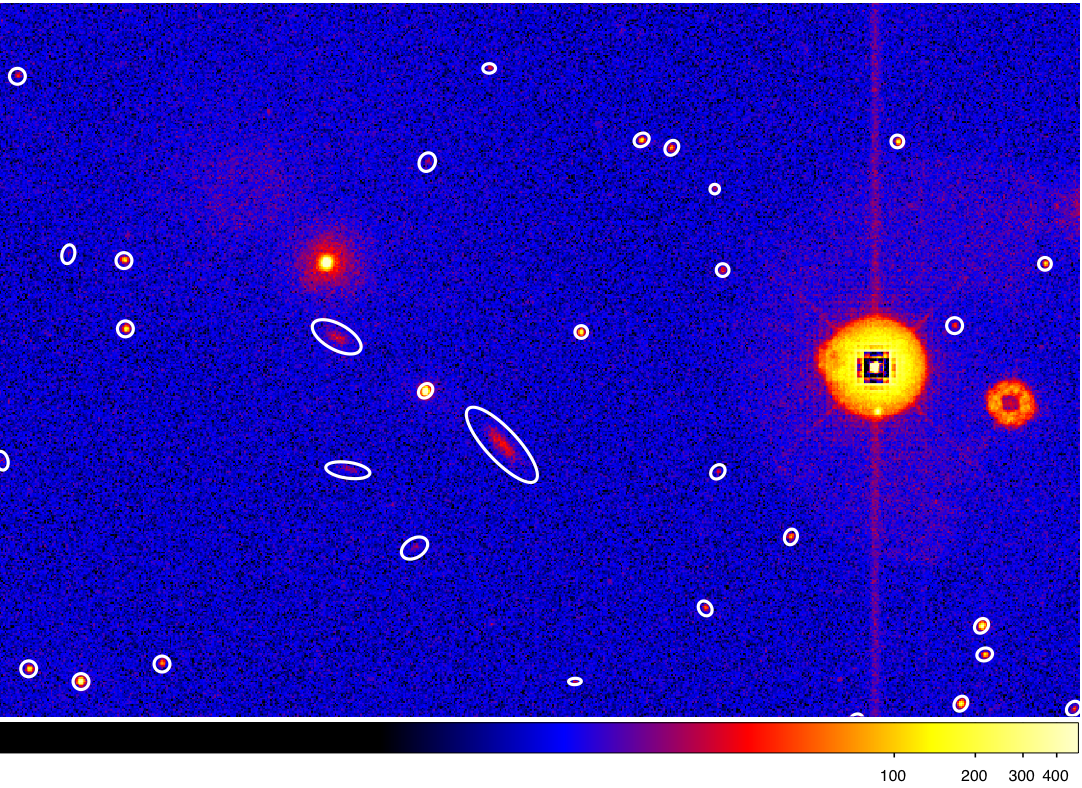 |
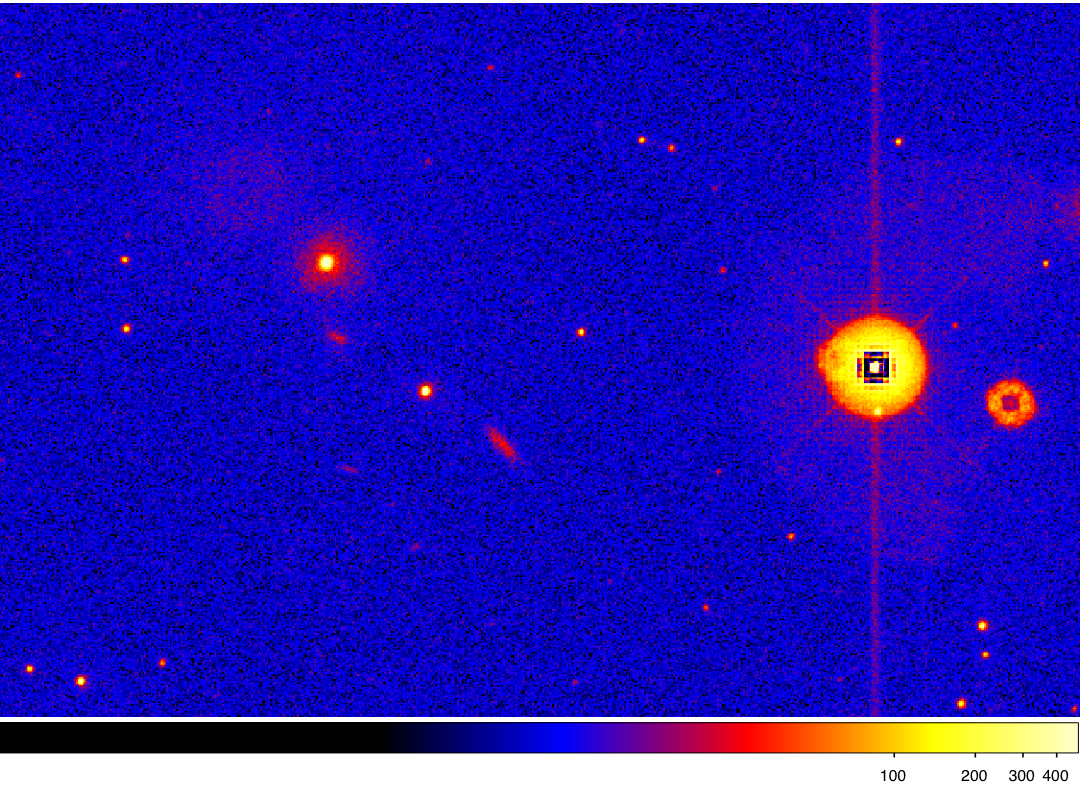
Figure 1: The left image is a UVW1 partial-field observed by the XMM-OM (OBSID=0302480501) containing many of the features searched for during quality testing. The sources overlayed on the right are those which have passed all automated quality tests. The white ellipses represent the FWHM extent of each source, which, in these cases, have been multiplied by a factor 2 for clarity.
Bad pixel
An object is flagged bad if the photometric aperture used to sum source counts across an image includes a bad pixel, as recorded in the Calibration Access Layer of the XMM-Newton Project. All of these pixels are already stored in the quality map constructed during the bad pixel determination and here the information is simply propagated to the source table.
|
 |
Figure 2: The sources overlayed on the right are those which have failed the bad pixel quality test. At least one pixel within the source or background extraction apertures contains a cosmetically-bad pixel.
Readout streak
Readout streaks occur because there is no shutter to block incident
photons during the finite time the CCD takes to readout, which is <
1.58% of the total exposure. The exact deadtime is dependent on
detector windowing. Streaks occur over a small number of pixel
columns, but stretch across all rows of the image, which is the CCD
clocking direction during readout (Fig 1). They can also occur because
the charge-transfer efficiency of the CCD is < 100% and when the
number of electrons collected in a CCD pixels exceeds its limited
capacity the extra electrons leak through the potential barriers
between pixels and smear along the CCD columns. Readout streaks are a
negligible effect unless sources approach or exceed the saturation
limit imposed by the detector frame rate. These bright sources cannot
be flux-calibrated to any accuracy and their readout streaks provide
two separate hazards:
- Saturated field sources will bias potentially both the flux and positions of neighbouring sources encroaching upon the readout streak.
- A readout streak may potentially generate spurious source detections.
An object with either a raw count-rate, Craw > 70 cnt s-1 or possessing a surrounding mod-8 pattern (flag bit 4) is considered a potential source of a readout streak and flagged (flag bit 1). The center of the readout streak is assumed to be coincident with the column containing the centroid of the bright source. Neighbouring sources situated within a distance threshold of the potential readout streak are also flagged. The default threshold is 16 unbinned pixel columns unless the raw-count rate of the bright source > 220 cnt s-1, in which case the threshold is 19 pixels.
In software-windowed modes, the source responsible for a readout streak may not be located on the image. A further test is performed upon these modes. The counts in a raw image are described by the array Cij where i is the column number and j is the row number. Our criteria for a column containing a potential readout streak is provided by the six conditions Cij > C(i-k)j, where k = -3, -2, -1, 1, 2, 3. If each criterion is met individually over >60% of the pixel rows then any source situated 19 unbinned pixels from the column are flagged as occurring over a potential readout streak.
|
 |
Figure 3: The sources overlayed on the right are those which have failed the readout streak test. They lie within the proximity of a CCD readout streak.
Smoke ring
Internal reflection of light within the detector window results in an out of focus ghost image of each source which is displaced radially by the curved detector window. A sources of brightness contained within the effective dynamic range of the instrument loses a negligible number of photons to smoke rings, but smoke rings they are noticeable artifacts of saturated sources (Fig 2).
Sources containing raw count rates > 60 cnt s-1 or surrounded by a mod-8 pattern are considered to be potential smoke-ring parents. The location of the center of a ring in raw unbinned pixels (ismoke,jsmoke), associated with a bright source at (isrc,jsrc), is predicted using the following parameterization:
|
ismoke = (A1 + ic) + A2x + A3y + A4x2 + A5y2 + A6xy jsmoke = (B1 + jc) + B2x + B3y + B4x2 + B5y2 + B6xy |
(2.5) |
(ic,jc) = (1024.5,1024.5) is the center of the Field of view. (x,y) = (isrc − ic,jsrc − jc). The coefficients are summarized in the following table:
| n | An | Bn |
|---|---|---|
| 1 | 9.6950 | -4.8165 |
| 2 | 1.2052 | 5.0884 |
| 3 | 1.1027 x 10⁻³ | 1.2071 |
| 4 | 2.9117 x 10⁻⁶ | -2.8810 x 10⁻⁷ |
| 5 | 1.8970 x 10⁻⁶ | 1.5490 x 10⁻⁶ |
| 6 | 4.2437 x 10⁻⁷ | -1.0783 x 10⁻⁶ |
An and Bn were constructed from a least squares fit to a random sample of 100 smoke rings. Neighbouring sources detected within a distance of 19" from the center of a potential smoke ring are flagged.
|
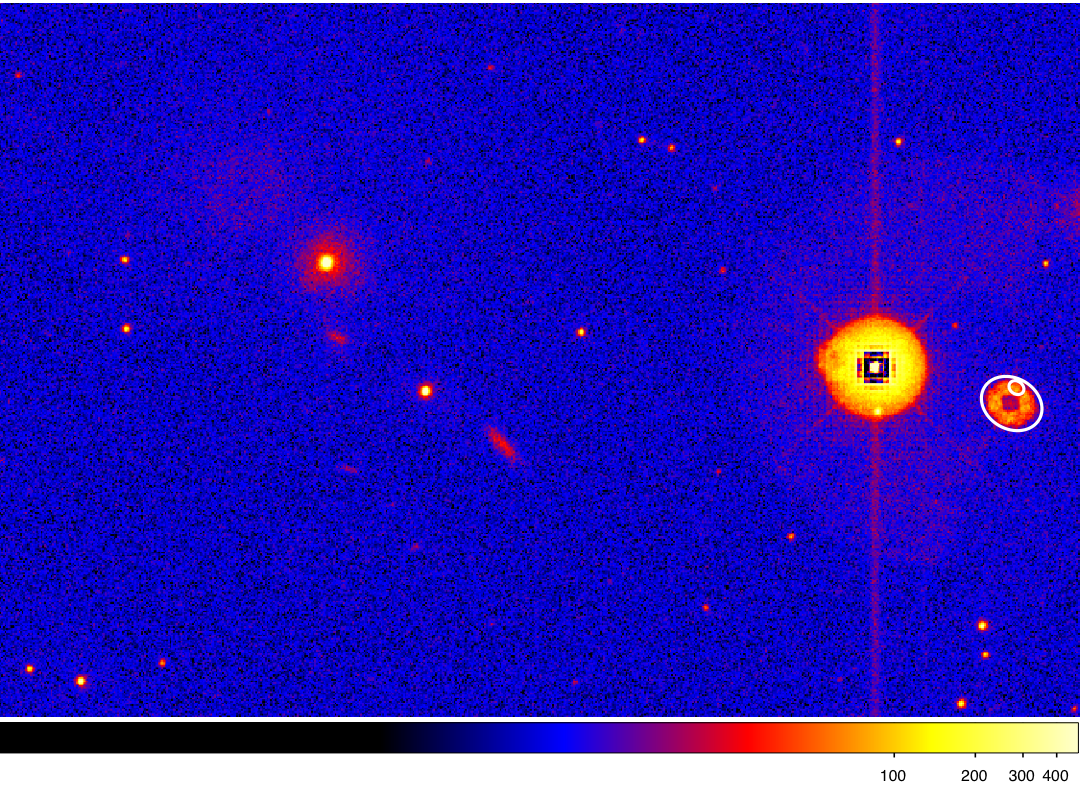 |
Figure 4: The sources overlayed on the right are those which have failed the ghost ring test. They lie within the proximity of a reflection ghost.
Diffraction spike
Mirror support trusses give rise to diffraction spikes in the brightest objects, that provide undesirable image structure around neighbouring sources and generate spurious detections. All catalogue objects with either Craw > 70 cnt s-1, or flagged as being surrounded by a mod-8 pattern are tested for diffraction spikes. We compare source number densities nbox and nspike. nbox is the density of objects with Craw < 5 cnt s-1 within a box 70.5x70.5 arcsec2, centred on the bright source. nspike is the average density of objects with Craw < 5 cnt s-1 within four rectangular regions oriented radially away from the bright source in directions 45°, 135°, 225° and 315° relative to the CCD columns. The region dimensions are 10x(Dmax − Dmin) arcsec2 (Dmin = 4.7 arcsec and Dmax = 56.4 arcsec from the source). If nspike > 3nbox then all detections within the four rectangular regions are flagged.
|
 |
Figure 5: The sources overlayed on the right are those
which have failed the diffraction spike test. They lie within the
proximity of diffraction spikes centered on a bright, saturated
source.
Bright source with Co-I-induced modulo-8 pattern
if the brightest pixel contained within an 8/δx x 8/δx box centered on a detection has a count rate, Cpix > 10 cnt s-1 then the object is flagged as a potential source of mod-8 structure. If Cpix < 0.5 cnt s-1 the detection passes the mod-8 test with no further action. All sources outside of these two criteria undergo a further test. A pattern search algorithm is performed by comparing structure to the left, right, above and below the source in raw image coordinates. For example, to the left of a source at pixel location (i0, j0), we:
- count the number of pixels, ni, in a column (i0 − 10 / δx, j0 − 16 / δx : j0 + 16 / δx) that have a count rate, Ci,j > 32 / δx.
- count the number of pixels, ni+1, that meet both the first criterion above and Ci,j > Ci+1,j + √Ci+1,j.
- count the number of pixels, ni-1, that meet both the first criterion above and Ci,j > Ci-1,j + √Ci-1,j > .
- if both ni+1 and ni-1 > 0.75ni then the left side of the detected source is considered to have mod-8 structure.
- if no structure is found then i = i − 1 and we iterate through steps 1 to 5 over a range of columns.
A similar test is performed upon columns to the right of the source and rows above and below the source. If a mod-8 pattern is found within two of the four sides then the source is flagged to be mod-8 pattern-affected.
|
 |
Figure 6: The source overlayed on the right failed the
modulo-8 fixed-pattern test. It lies within the proximity of mod-8
image structure.
Central Enhancement
Sky background photons from outside the field-of-view are scattered off a chamfer in the detector window housing, causing a background enhancement of a factor 2−3 within the central image pixels. Sources within 1.25 arcmin of the instrument boresight are flagged.
|
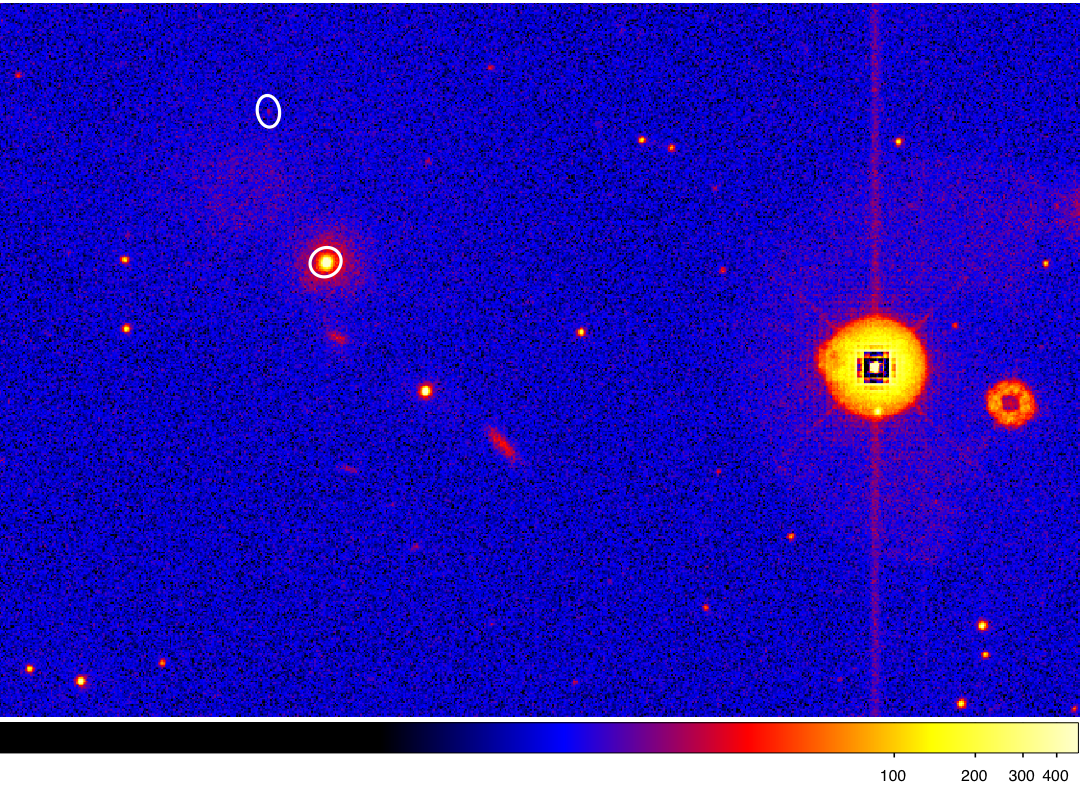 |
Figure 7: The sources overlayed on the right are those
which have failed the scattered light test. They lie within or close
to the enhanced background region at the center of the
field-of-view.
Bright Neighbour
For each source with either a raw count rate Craw,b
> 80 cnt s-1 or which has failed the mod-8 pattern test,
attempt to identify any sources which may be confused with the wings
of the bright point spread function. If the distance to neigbouring
source rn <
min{17.5Craw,n/Craw,b, 33} arcsec
then the neighbouring source is flagged, where Craw
is the raw count rate of the neighbour.
Image Edge
if any portion of the source extraction region falls off of the edge
of the image then the source is flagged. Both the source photometry
and astrometry may be affected.
|
 |
Figure 8: The source overlayed on the right failed the
scattered image edge test. It's extraction aperture lies over the edge
of the field.
Point Source within Extended Source
If a pixel is shared by the extraction aperture of both a point
source and an extended source then the point source is flagged (in practice, no sources are labelled with this flag in the catalogue).
Too Compact
Although the SAS processing checks the raw data for image bits which have been corrupted, artifacts are occasionally missed and sources are occasionally found which are too compact to be consistent with the XMM-OM point spread function. Such sources are likely to be spurious.
SAS task: omdetect