
Source Properties: Source Detections
Ignoring multiple detections of the same object during a pointing, there are 753,578 sources within the XMM-OM SUSS. Taking into account detections of the same source during different pointings the number of unique sources within the catalogue is 624,049. Fig. 1 plots the detection significance distribution of all the good-quality sources contained within the catalogue, separated by filter. The discontinuous low-significance cut-off is artificial and the result of rejecting potential source detections at significance levels < 3σ. The discontinuity observed at 10σ occurs because sources below this value undergo a secondary significance calculation using a smaller circular source aperture of radius 2.8 arcsec. The significances for sources above this value are calculated with aperture radii of 5.6 arcsec. Sources with a quality flag > 0, in any filter, are not included in fig 1.
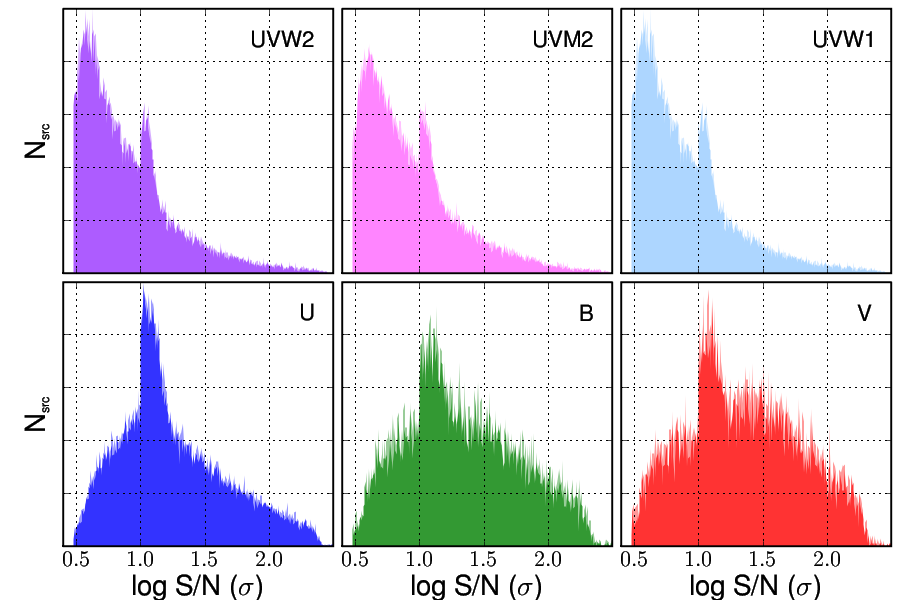
Figure 1: The normalized detection significance distributions of sources contained within the XMM-OM catalogue. Nsrc is the number sources per significance bin.
The dichotomy between UV and optical distributions is a result of the differing way these sources are selected for inclusion in the catalogue. All UV detections > 3σ are catalogued, whereas only optical detections > 3σ and with a UV-counterpart > 3σ are selected for inclusion. Number counts for source detections through each filter are provided in Table 1. XMM-Newton is primarily an X-ray observatory and many of its science programs contain no optical or UV aspect beyond the serendipitous detection of field sources. UVW1 and U are the often the default filters during pointings because they optimize throughput with scientific impact, and the distribution of sources in Table 1 reflects that.
| Filter | Ndet (> 3σ) | Nsrc (> 3σ) | fobs (%) |
|---|---|---|---|
| UVW2 | 119,805 | 96,814 | 15.9 |
| UVM2 | 145,210 | 120,510 | 19.3 |
| UVW1 | 618,266 | 521,507 | 82.0 |
| U | 177,569 | 146,329 | 23.6 |
| B | 81,191 | 62,966 | 10.8 |
| V | 78,160 | 57,498 | 10.4 |
Table 1: Detection statistics for each of the six XMM-OM lenticular filters included within the catalogue. Ndet is the number of source detections, Nsrc is the number of unique detections after accounting for multiple detections over different pointings. fobs is the fraction of total sources detected through the filter.
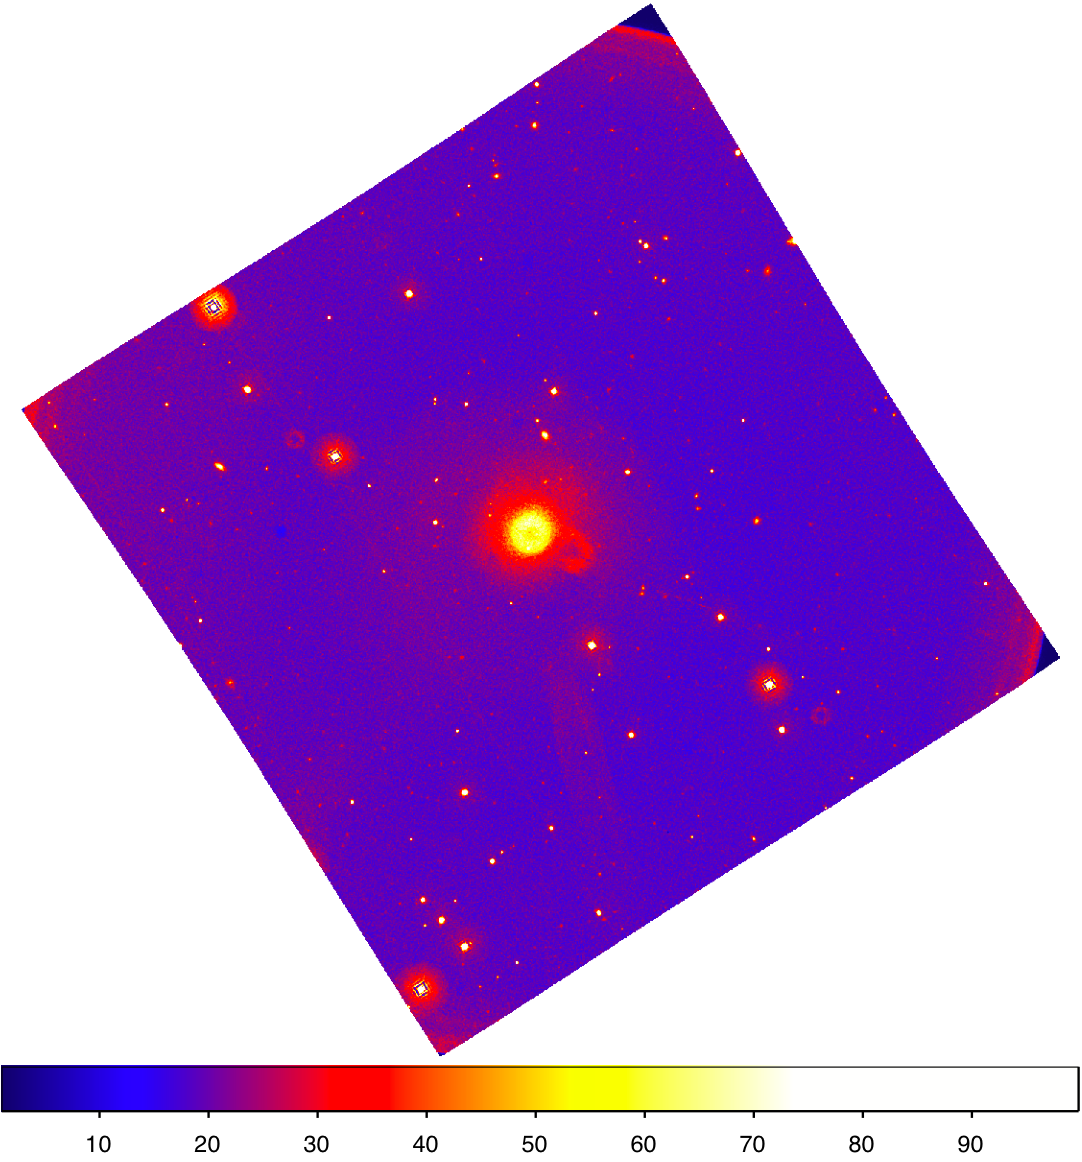
The 3σ inclusion limit is of course arbitrary and many real, faint sources are excluded from the catalogue due to this limit. The trade-off is to maximize the number of real detections while minimizing the number of spurious sources. In order to test the fidelity of the OM source detection algorithm, it's performance on a 1 ksec B-filter exposure of the field centered on RA = 13h 34m 40s.19, Dec = +37° 54' 58".9 (J2000), was compared to a deeper, independent source list. This particular field is the 13H XMM-Newton/Chandra Deep Field and the independent source list was extracted from a Johnson B exposure obtained by the 8-m Subaru telescope, photometrically calibrated against the Sloan Digital Sky Survey (SDSS). Both the XMM-OM and Subaru images are provided in Fig 2. The Subaru sources have a point spread function full-width half-maximum of 0.87 arcsec and a 2 arcsec aperture, 3σ limiting AB magnitude of B < 27.0 (Seymour et al. 2008; T. Dwelly, private communication).
 |
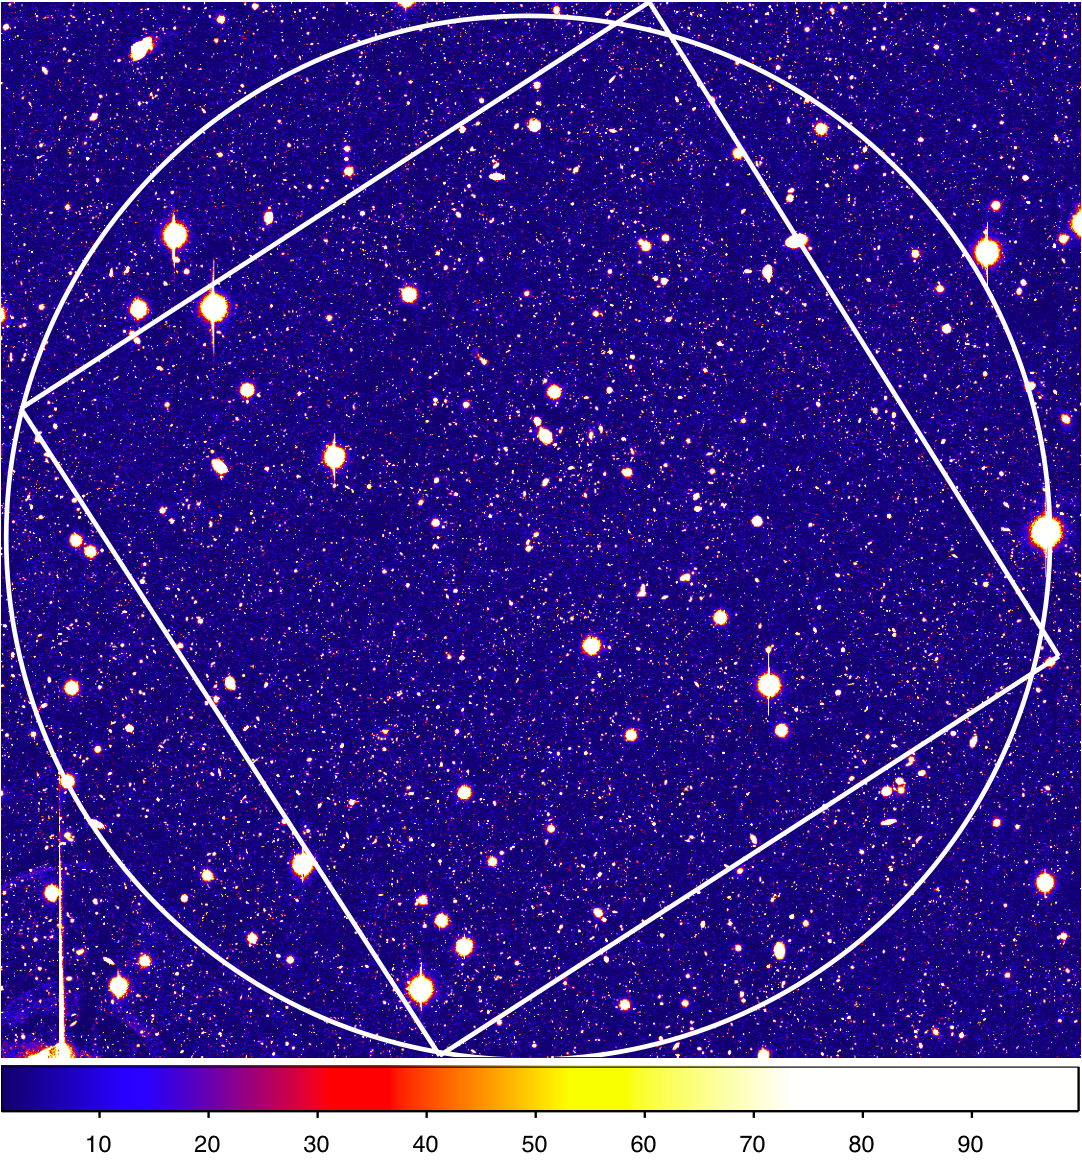 |
Figure 2: The 13-hour Subaru field. The left panel contains the XMM-OM B-filter image. The right panel contains the corresponding Subaru B-filter image with the OM field of view (diamond) overlayed. Due to vignetting, the OM detector is not sensitive to sources outside of the overlayed circle. All sources used for comparison between the XMM-OM and Subaru detection characteristics are taken from within both the diamond and circular regions. The Subaru image and source list were provided by Tom Dwelly, University of Southampton.
The Subaru 13h-field source list provided by Dwelly et al. was constructed using the SExtractor2.5.0 software. The Subaru image contains a larger sky area, 37x29 arcmin2 compared to the 17x17 arcmin2 XMM-OM field-of-view. Consequently the Subaru source list was screened for objects that are situated within the XMM-OM field-of-view and inside the vignetting limits in the corners of the field, finding 26,255 Subaru detections.
The right hand panel of figure 3 compares the magnitude distributions of the XMM-OM and screened Subaru source list. Several detections within the XMM-OM image of smoke rings had to be removed from the sample. On the left, we plot the B magnitudes of the XMM-OM sources with their nearest counterparts in the Subaru list. Th filter bandpasses differ slightly and, while we have complementary XMM-OM U band data, we have not attempted a colour correction because the U filter is not as sensitive as B. The magnitude-magnitude distribution has two tales at the bright end. The most-populated tail deviates because the Subaru field saturates at B < 19. Several sources form their own tail, following the linear relation, and these are all extended objects which saturate at brighter magnitudes. Outliers at faint magnitudes are all the result of source confusion rather than photometric variability. A more suitable evaluation of the XMM-OM absolute photometry is performed in the section Source Properties: Photometry.
Where the magnitude-magnitude diagram is linear, between 19.0 < B < 22.0, the Subaru and XMM-OM distributions indicate good detection consistency between the two instruments. There is neither a significant population of spurious sources or undetected objects in the XMM-OM field. There appears to be a small deficit of XMM-OM sources between 20.5 < B < 20.9. However each of these Subaru objects are detected by the SAS pipeline software, albeit with slightly different magnitudes. The statistical likelihood of this occurring for non-variable sources has yet to be investigated.
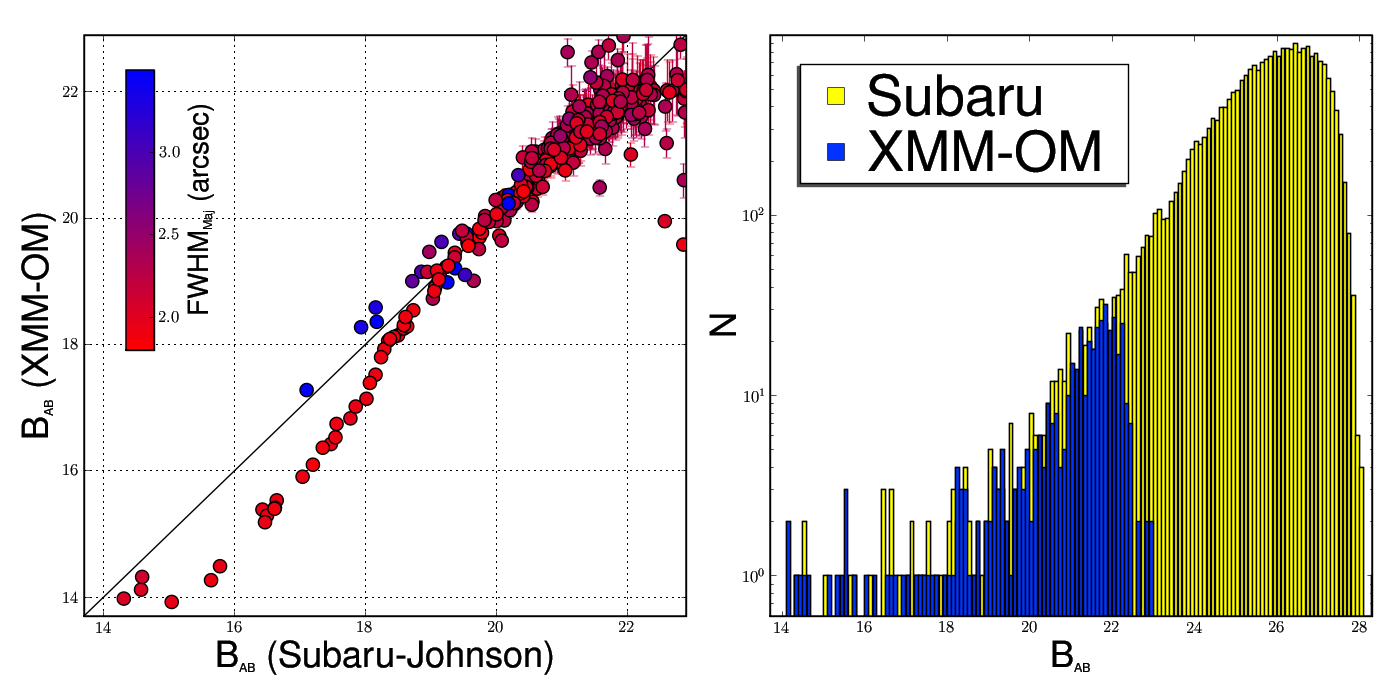
Figure 3: The left panel contrasts the AB B magnitude of XMM-OM sources with their AB B Subaru counterparts. The Subaru filter is part of the Johnson system, whereas the XMM-OM B filter is similar, but not identical. Despite this small difference, no colour correction has been applied to the data because the other XMM-OM filters do not go as deep as B. Sources have been matched between the two catalogues using the simple criteria of nearest source within 3 arcsec. Colour coding is a function of source extent on the sky, point sources are red, the most-extended sources are blue. Error bars are 1σ confidences. The right hand panel provides a histogram of XMM-OM and Subaru source magnitudes.