
Source Properties: Quality Flags
Quality flags pertaining to potentially damaged photometry or astrometry are stored in the catalogue. Flags are constructed autonomously during pipeline processing and the details of the flagging algorithms are provided in the Data Processing: Quality Flags section. Each source has a maximum of six quality flags, one for each filter in which it can have a detection. Table 1. summarizes the quality flags, how they are combined and where they are stored.
| i | Fi | Description |
|---|---|---|
| 0 | 1 | Source lies over a cosmetic detector defect (bad pixel) |
| 1 | 2 | Source lies potentially over a readout streak originating from a bright field object |
| 2 | 4 | Source lies potentially over a smoke ring originating from a bright field object |
| 3 | 8 | Source lies potentially over a diffraction spike originating from a bright field object |
| 4 | 16 | Bright source surrounded by coincidence-loss-induced modulo-8 pattern |
| 5 | 32 | Source lies within the central image, where the background is enhanced by scattered light |
| 6 | 64 | Potential source confusion with an object detected nearby |
| 7 | 128 | Source aperture lies across the outer edge of a raw detector image |
| 8 | 256 | A point source which lies within, or partially-within, an extended source |
| 9 | 512 | Source is too compact (inconsistent with the PSF) |
Table 1: Quality flags are stored in the catalogue column FILTER_QUALITY_FLAG, where FILTER is either UVW2, UVM2, UVW1, U, B or V. The integer number is simply the sum of all individual flags ΣFi, where i = 0,1,2,..,8 is the flag number. The meaning of each flag is summarized below, whereas a full description of the algorithms used to set the flags is presented in the Data Processing::Quality Flags section. The word 'source' is used liberally to include both the source and background extraction regions. As an example, a source situated over a bad pixel, on a diffraction spike and at the edge of an image will have a quality flag of ΣFi = 1 + 8 + 128 = 137. A source with quality = 0 passes all of the above tests.
Filter Dependence
Figure 1 displays a typical XMM-OM field through three filters, UVW2, UVW1 and B. As a consequence of both the spectral properties of typical field sources and the effective area of the instrument, the B image is the most crowded and source count rates through B, with a few exceptions, are larger. Five of the catalogue quality flags, readout streaks, smoke rings, diffraction spikes, mod-8 noise and bright neighbours, are the result of bright sources in the field. Many of these qualities can be seen by eye in the B image example, as well as source saturation and an enhanced background at the center of the image caused by diffuse light reflected from outside the field of view.
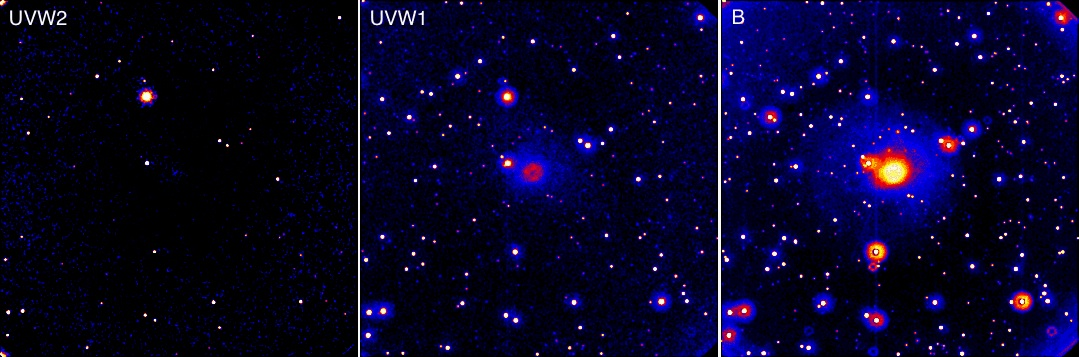
Figure 1: A typical OM field observed through the UVW2, UVW1, and B filters. The effective area of the OM, source brightnesses (in general), and source density increase towards the optical. The number of quality issues therefore increase towards optical wavelengths.
As we step through the filters towards the UV wavelengths, both the effective area, intrinsic brightness of typical celestial sources and background photon rates decrease. As a consequence so does the number of quality issues. Diffuse scattered light, a readout streak and smoke rings are still visible in the UVW1 image but at a reduced frequency and intensity relative to the B image. The UVW2 image contains a faint central enhancement but no other quality issues related to bright sources.
Quality Statistics
Inspection of the catalogued sources reveal the same trends across the filters. Those flags that are typically set when sources are bright or have bright neighbours dominate the optical images but become less frequent in the UV. In contrast, bad pixels, image edge and extended source flags reveal a relatively flat distribution across the filters. Central enhancement statistics also remain flat despite quantity of scattered light falling as the wavelength decreases. This is because the flagging algorithm makes no attempt to quantify scattered light which depends on pointing direction and exposure time. Sources will simply be flagged if they are located within the fixed-size, central cone whose characteristics have been iterated upon by screening multiple observations. So while, in real terms, the fraction of UV sources found over a scattering-enhanced background is smaller than the optical fraction, our conservative approach to source quality means that this property is not apparent in the quality flags.
At face value, the fraction of edge-of-image sources appears large. But each field is often comprised of multiple sub-images increasing the probability of an image edge impinging upon a source. Edges have an impact on both astrometry and photometry. With reference to both the many potential image windows and spacecraft pointing drift, particular notice of the edge flag should be taken when searching for source variability.
Quality Screening
Whether performed interactively, by eye or through pipeline algorithms, quality flagging is not an exact process. The algorithms described in the Data Processing: Quality Flags section were defined and refined based on data experience as the XMM program matured. There is no expectation that the flagging algorithms will isolate all cases of quality issues because they need generally to be tailored to a wide variety of conditions. The algorithms can only be optimized to catch as many sources as possible. The large size of the catalogue makes a complete assessment of quality flagging impractical, but as part of post-compilation catalogue screening, 100 random observations (4.2% of the catalogue) were inspected by eye for quality flag fidelity. The results are provided in tables 2−9. Each table provides:
- Nexp, the total number of images in the random sample.
- Nx, the total number of sources found with a raised quality flag.
- fnx, the number of sources which potentially contain the quality x but were not flagged by the autonomous algorithms. This is specified as a fraction of Nx.
- fex, the fraction of Nx potentially erroneously identified to contain the quality x by the autonomous processing.
fnx is the fraction of false-positives, fex is the fraction of false-negatives.
|
|
|
|
||||||||||||||||||||||||||||||||||||||||||||||||||||||||||||||||||||||
|
|
|
|