
|
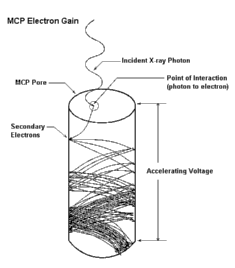
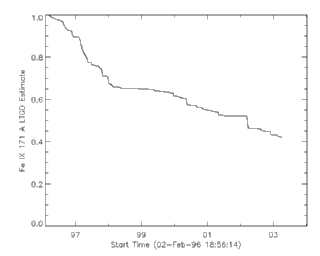
The secondary Electron yield of each channel of an MCP declines as charge is continuely extracted. In effect the overall gain of the detector will reflect the history of events recorded, with an uneven gain accross the detector commonly termed long term gain depression (LTGD). |
|
The GIS benefits from having small tungsten filaments located within each detector which can be used to characterize the gain across the MCP. These flood the detectors with low energy electron which should provide a flat field. The detector is operated in the usual way, except that instead of EUV photons from the curved grating, the detector is illuminated with electrons emitted from the filament. These electrons create secondary electrons when they strike the face of the detector. From then on the operation of the detector is identical, with a cascade occurring in the pores of each plate and a spray of electrons striking the SPAN . |
|
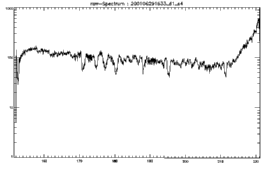
| The plot to the right illustrats the flat field for GIS detector 1 which obtained using the filaments in 2001. The regions of LTGD are clearly evident. The filaments are obtained, by putting a positive bias on the front of the MCP so that the electrons from the filaments accumulate and form a reasonable distribution. The distribution is by no means a flat field as is evident by the large scale modulation of the output. This reflects the gross distribution of the electron cloud produced by the filaments. |
|
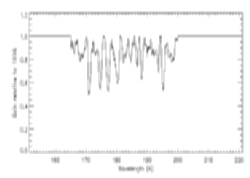
| In the plot to the left the large scale modulation due to the electron cloud distribution has been removed leaving the estimate for the flat field for detector 1, in 2001.The loss in sensitivity amounts to the order of 50% for the most affected regions |
|
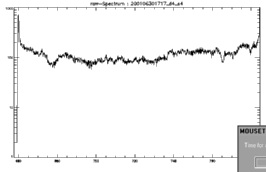
An investigation of the other detectors displayed similar evidence for LTGD for detector 2. Detectors 3 and 4 displayed relatively modest losses of the order of 20% for 2001, making it difficult to produce a similar flat field. The Filament data for detector 4 is illustrated below. |
|
|
 |
|
|
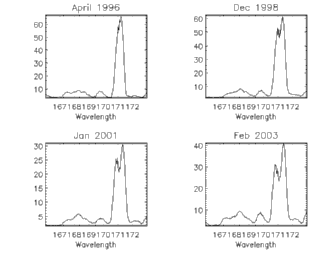
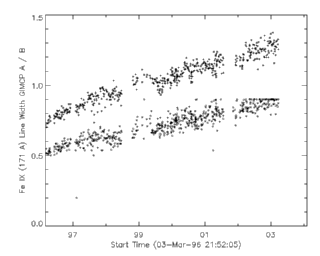
The figure below illustrates the evolution of the line width for the GIMCP obervations. It is clear that there has been a steady broadening of the emission lines. This broadening may have two origins. |
|
|
|
|
|
|
|
|
|