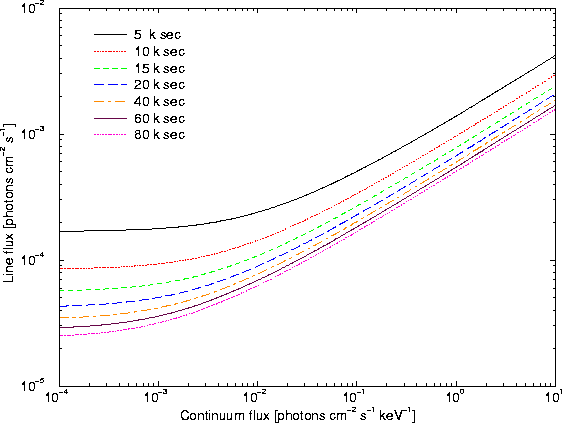
As a measure of the RGS sensitivity the detection threshold for a
few prominent lines in the 0.35-2.5 keV range has been modeled using
SciSim. As examples, the following lines were chosen: the O VII
line complex (at 0.57 keV), the Ne X line (at 1.022 keV)
and the Si XIII line (at 1.86 keV). The RGS line sensitivity
plots displayed in Figs. 55-57
provide an estimate of the exposure time necessary to detect a line above a
certain underlying continuum at a significance level of 5-![]() .
The
calculations were performed for one RGS. It is in all cases assumed
that the line emission emanates from a point source.
.
The
calculations were performed for one RGS. It is in all cases assumed
that the line emission emanates from a point source.
 |
 |
 |
The calculations are based on the line flux integrated over the HEW of the line profile, assuming Gaussian error propagation. For such an estimate, four contributing components must be considered:
The X-ray background varies over the sky. In order to provide a graphical representation of RGS's sensitivity which is independent of the source coordinates on the sky, the X-ray background was not considered directly. However, at the discussed energies the extragalactic X-ray background can well be reproduced by a power-law spectrum. This allows us to consider the X-ray background simply by adding an additional component to the continuum flux of the source. In general, the ``continuum flux'' in the plots can therefore be assumed to contain in practice a contribution from both the source continuum and the X-ray background at the position of the source.
The particle-induced background, which depends on the design of the
instruments, is considered in the calculation of the curves. We assume a
particle-induced background of
![]() counts mm-2 s-1
keV-1. This is a mean number, which accounts for the normal fluctuation
in solar activity. For the given lines we assumed a geometrical area for
particle hits of 7.2, 10.8 and 12.5 mm2.
counts mm-2 s-1
keV-1. This is a mean number, which accounts for the normal fluctuation
in solar activity. For the given lines we assumed a geometrical area for
particle hits of 7.2, 10.8 and 12.5 mm2.
The plots allow a first estimate of the exposure time in the sense that unreasonable sources can be rejected during a pre-selection of possible targets. They give a basic idea of whether or not it is possible to detect lines. They are not intended to (and cannot) substitute detailed simulations with realistic spectra with SciSim for sources where a detection and/or separation of one or more emission lines is the main scientific goal.