
Flux calibration UV Grism: clocked mode
The old web pages are here:
General considerations
The UVOT Clocked Grism mode is the best mode for the instrument. The reasons are that it covers the ultraviolet part of the spectrum from about 1700 A upward, and that due to the special ‘clocked’ position it enjoys both a lower background, as well as no zeroth orders in the upper left half of the detector.
The accuracy of the first order wavelength calibration is discussed in ../_grism/UVclocked/wavecal_acc.html.
In general the orders overlap in the UVOT grisms, but for the uv grism the second order separates from the first order in the upper right hand and lower left corners, while it overlaps the first order in varying degrees in the middle parts of the detector. A rough estimate of the dispersion of the second order, and the position of the second order relative to the first, was determined using the WR spectra. A more careful calibration still needs to be done. Since the uv grism was not blazed, the second order presence must be accounted for.
Calibration sources
The flux calibration of first and second order is dependent on where the second order of the spectra becomes bright. To establish the calibration of the first order, both white dwarfs and F-type stars were used. Whereas the WD spectra are very bright at the blue end of the spectrum, the F0 spectra are faint in the uv, and thus the second order contributions to the first order flux is not an issue up to much longer wavelengths. For the flux calibration we have been using the following Calibration sources.
Coincidence loss
The background in the grisms is high enough to experience coincidence loss as discussed in Coincidence loss. The correction factor to the net flux is in the range 1.0-1.10 using the usual method (see also Breeveld et al. 2011 for a discussion of the applicability of the standard correction method for point sources to the background). For the flux calibration/effective area determination images with a background with a correction factor higher than 1.05 were not used.
Effective Areas
The method described in The calibration overview was used. The individual effective area curves at the centre of the detector are shown in the figures below. The following sources were used: “WD1657+343”, “WD1057+719” below 2750A, and “GSPC P177-D”, “GSPC P041-C” above 3100A. The effect of overlapping second order emission is minimized by that choice, but above 4900A can not be avoided. A redder calibration source will be required for that.
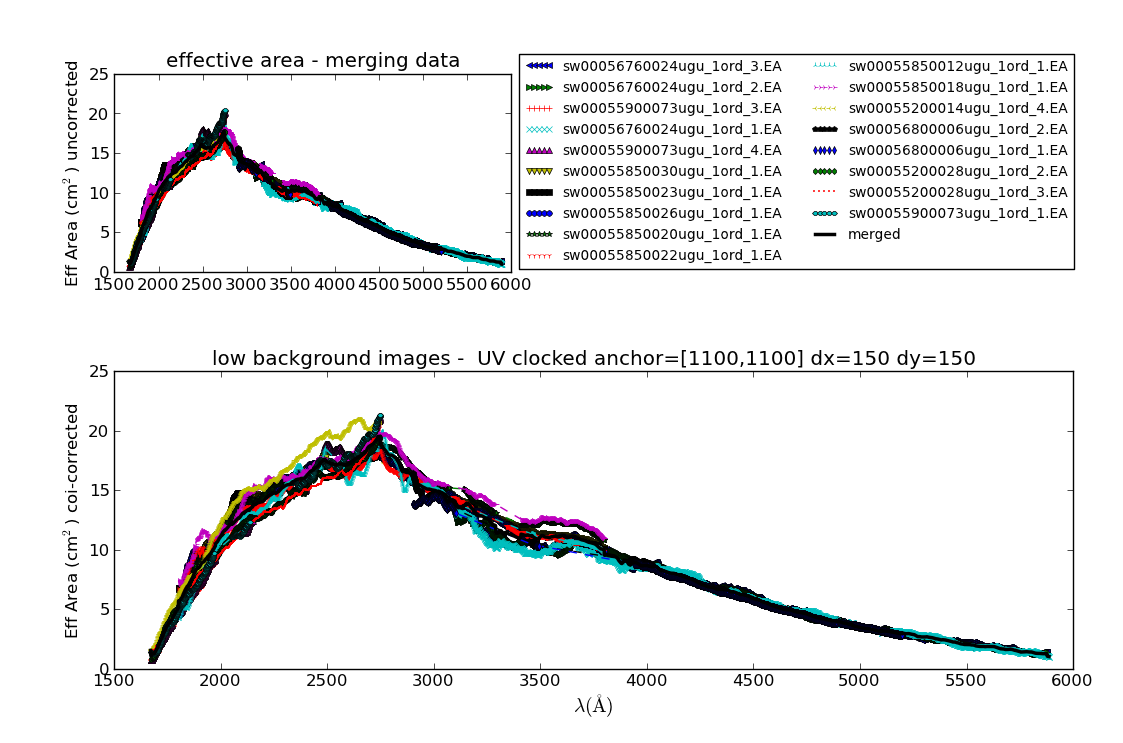
The flux calibration at default position
The curves at the bottom have been corrected using the algorithm described on the main flux page. The weighted mean of the curves and the RMS error derived from the spread of the individual curves is shown more clearly in the figure below.
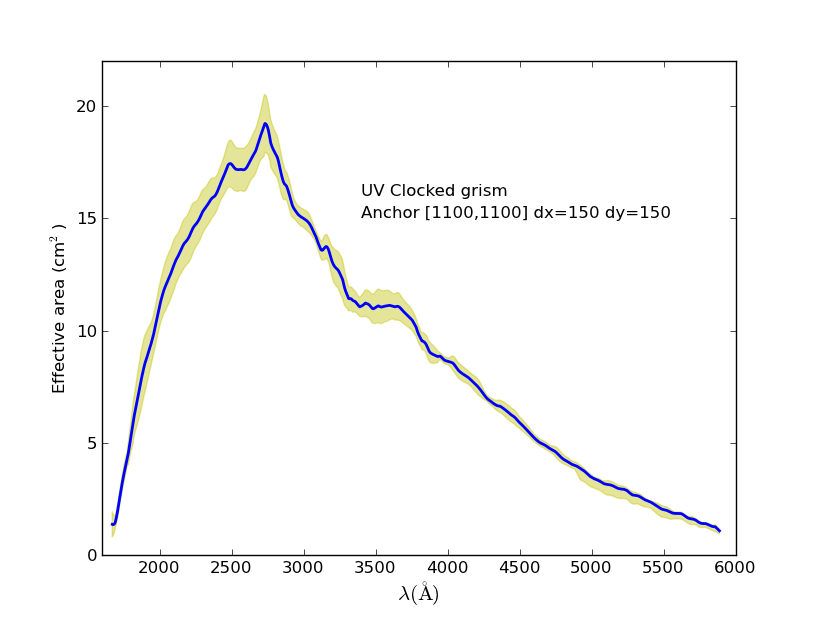
merged EA at default position clocked UV grism
The curve is very similar to that found for the nominal UV grism. The peak at 2750A is more pronounced and may partly be due to the onset of second order emission in the WD spectra. The error is larger than in the nominal grism, which is due to a smaller total exposure time in the available calibration images after filtering out data that did not qualify. An additional error above 4900A has been added ad-hoc to show the expected second order contamination.
Verification
The effective areas have been used on some of the spectra from calibration sources that were not used in the derivation of the effective area to check how well the fluxes fit in the Verification of the flux calibration in the UV clocked grism.