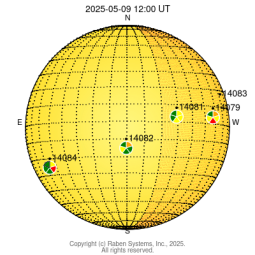
Location of Active Regions
[Key]
( 1-Jun-2025 00:00)
|
Context Image
()
|
|
|
Plot of Flare Locations
(On a context image)
Synoptic Plot: STEREO and Earth views
STEREO SECCHI Beacon Images
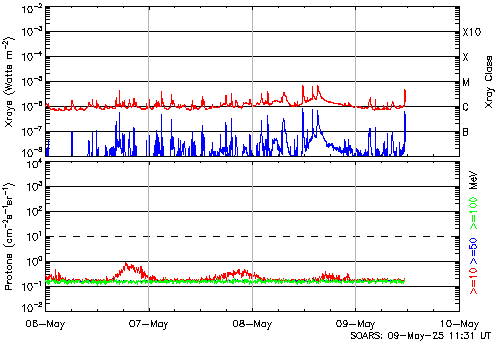
GOES X-rays and Protons
This page is being maintained and updated by the HELIO project.
It was originally created as part of the
SOARS project.
(AR Location plot by Raben Systems;
Images from SolarMonitor; GOES data from NOAA/SWPC)
(Context image normally SDO AIA 193Å – others used if non available)
|
Flaring Probability by Active Region (NOAA/SWPC)
Forecast for: 01-Jun-2025
AR No. |
C Class |
M Class |
X Class |
Proton |
14096 |
10% |
1% |
1% |
1% |
14099 |
65% |
25% |
5% |
5% |
14100 |
95% |
50% |
15% |
10% |
14101 |
25% |
5% |
1% |
1% |
14104 |
20% |
5% |
1% |
1% |
(Issued at ~2200 UT on previous day)
Observed Flares by Active Region (LMSAL & SOARS)
AR No. |
C Class |
M Class |
X Class |
Total |
N/A |
1 |
1 |
0 |
2 |
14099 |
2 |
0 |
0 |
2 |
14100 |
10 |
3 |
0 |
13 |
14104 |
2 |
1 |
0 |
3 |
(AR locations: NOAA/SWPC)
(Totals includes all flares ≥A class)
This table is under construction
Recent Flares (NOAA/SWPC, LMSAL & SOARS)
(Only flares ≥C class are listed)
Recent Halo CMEs
(SIDC: CACTUS)
CME Start |
Onset (early/late) |
PA |
dA |
Vel. |
2025/05/30 23:48 |
2025/05/31 20:58 2025/06/12 20:26 |
139 |
360 |
0919 |
2025/05/30 07:12 |
2025/06/02 04:38 2025/06/16 15:52 |
101 |
144 |
0201 |
(PA measured counter-clockwise from N)
|